Carter's, Inc. (CRI): Price and Financial Metrics
GET POWR RATINGS... FREE!
CRI POWR Grades
- Quality is the dimension where CRI ranks best; there it ranks ahead of 92.46% of US stocks.
- The strongest trend for CRI is in Momentum, which has been heading down over the past 179 days.
- CRI ranks lowest in Growth; there it ranks in the 26th percentile.
CRI Stock Summary
- Of note is the ratio of Carters Inc's sales and general administrative expense to its total operating expenses; 97.4% of US stocks have a lower such ratio.
- Over the past twelve months, CRI has reported earnings growth of 160.98%, putting it ahead of 87.5% of US stocks in our set.
- The volatility of Carters Inc's share price is greater than that of only 11.17% US stocks with at least 200 days of trading history.
- Stocks that are quantitatively similar to CRI, based on their financial statements, market capitalization, and price volatility, are UFPI, SIGI, AFI, FL, and WOOF.
- Visit CRI's SEC page to see the company's official filings. To visit the company's web site, go to www.carters.com.
CRI Valuation Summary
- In comparison to the median Consumer Cyclical stock, CRI's price/sales ratio is 7.14% lower, now standing at 1.3.
- CRI's price/sales ratio has moved up 1.1 over the prior 217 months.
Below are key valuation metrics over time for CRI.
Stock | Date | P/S | P/B | P/E | EV/EBIT |
---|---|---|---|---|---|
CRI | 2021-08-27 | 1.3 | 4.2 | 13.5 | 10.4 |
CRI | 2021-08-26 | 1.3 | 4.2 | 13.5 | 10.3 |
CRI | 2021-08-25 | 1.4 | 4.3 | 13.8 | 10.6 |
CRI | 2021-08-24 | 1.4 | 4.3 | 13.9 | 10.7 |
CRI | 2021-08-23 | 1.4 | 4.2 | 13.8 | 10.5 |
CRI | 2021-08-20 | 1.4 | 4.2 | 13.8 | 10.5 |
CRI Growth Metrics
- The 5 year net cashflow from operations growth rate now stands at -3.77%.
- Its 4 year cash and equivalents growth rate is now at 92.11%.
- Its year over year cash and equivalents growth rate is now at 38.81%.

The table below shows CRI's growth in key financial areas (numbers in millions of US dollars).
Date | Revenue | Operating Cash Flow | Net Income to Common Stock |
---|---|---|---|
2021-12-31 | 3,486.44 | 268.258 | 339.748 |
2021-09-30 | 3,414.244 | 277.085 | 341.789 |
2021-06-30 | 3,388.738 | 400.604 | 338.054 |
2021-03-31 | 3,157.223 | 564.666 | 274.607 |
2020-12-31 | 3,024.334 | 589.894 | 109.717 |
2020-09-30 | 3,134.96 | 633.988 | 135.85 |
CRI's Quality Factors
The “Quality” component of the POWR Ratings focuses on 31 different factors of a companies fundamentals and operational strength. Here are some key insights as we drill into the specifics of these quality attributes.- CRI has a Quality Grade of B, ranking ahead of 87.42% of graded US stocks.
- CRI's asset turnover comes in at 1.026 -- ranking 14th of 32 Apparel stocks.
- SKX, OXM, and GES are the stocks whose asset turnover ratios are most correlated with CRI.
The table below shows CRI's key quality metrics over time.
Period | Asset Turnover | Gross Margin | ROIC |
---|---|---|---|
2021-10-02 | 1.026 | 0.479 | 0.185 |
2021-07-03 | 1.019 | 0.475 | 0.180 |
2021-04-03 | 0.943 | 0.468 | 0.141 |
2021-01-02 | 0.914 | 0.434 | 0.063 |
2020-09-26 | 0.995 | 0.419 | 0.071 |
2020-06-27 | 1.052 | 0.415 | 0.058 |
CRI Price Target
For more insight on analysts targets of CRI, see our CRI price target page. And for a list of of all stocks sorted by upside potential based on analyst target price, see our Top Price Target page.
Average Price Target | $120.75 | Average Broker Recommendation | 1.6 (Moderate Buy) |
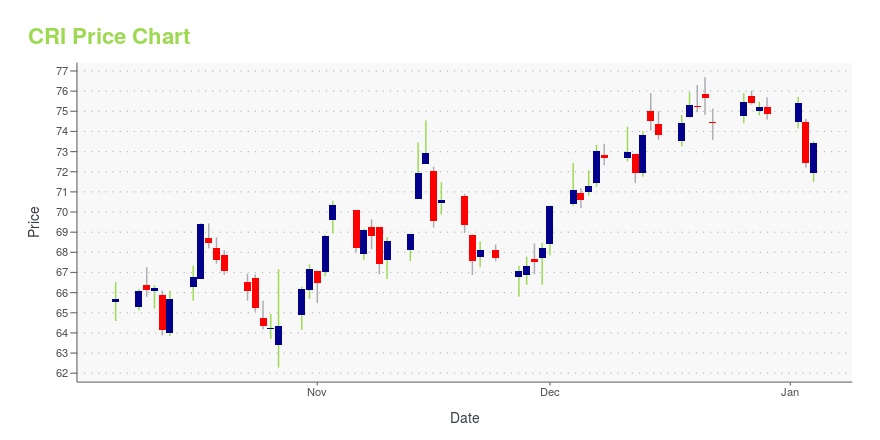
CRI Stock Price Chart Interactive Chart >
CRI Price/Volume Stats
Current price | $70.48 | 52-week high | $111.17 |
Prev. close | $70.99 | 52-week low | $67.88 |
Day low | $68.88 | Volume | 724,000 |
Day high | $70.81 | Avg. volume | 627,424 |
50-day MA | $78.53 | Dividend yield | 4.26% |
200-day MA | $92.56 | Market Cap | 2.87B |
Carter's, Inc. (CRI) Company Bio
Carters, Inc. and its subsidiaries design, source, and market branded childrenswear under the Carters, Child of Mine, Just One You, Precious Firsts, OshKosh, and other brands. The company operates through five segments: Carters Retail, Carters Wholesale, OshKosh Retail, OshKosh Wholesale, and International. The company was founded in 1865 and is based in Atlanta, Georgia.
Latest CRI News From Around the Web
Below are the latest news stories about Carters Inc that investors may wish to consider to help them evaluate CRI as an investment opportunity.
Why Carter's Stock Was Climbing TodayShares of Carter's (NYSE: CRI) were moving higher Friday after the maker of baby apparel and products posted strong results for its fiscal fourth quarter, beating estimates on the top and bottom lines. Carter's, which also owns the OshKosh B'Gosh and Skip Hop brands, said it saw strong demand over the holiday season. It recorded 11% revenue growth in the period (adjusting for the fact that 2020's fiscal Q4 had an additional week) to $1.06 billion, slightly above analysts' top-line expectation of $1.03 billion. |
Carter's (CRI) Q4 Earnings and Revenues Beat EstimatesCarter's (CRI) delivered earnings and revenue surprises of 13.24% and 3.66%, respectively, for the quarter ended December 2021. Do the numbers hold clues to what lies ahead for the stock? |
Carter’s, Inc. Reports Fourth Quarter and Fiscal 2021 ResultsATLANTA, February 25, 2022--Carter’s, Inc. (NYSE:CRI), the largest branded marketer in North America of apparel exclusively for babies and young children, today reported its fourth quarter and fiscal 2021 results. |
Solid Demand & Online Growth to Aid Carter's (CRI) Q4 EarningsCarter's (CRI) Q4 results are likely to reflect gains from solid demand and sturdy e-commerce business. Higher freight costs and supply-chain issues are likely to have acted as deterrents. |
Carter's (CRI) Expected to Beat Earnings Estimates: Should You Buy?Carter's (CRI) possesses the right combination of the two key ingredients for a likely earnings beat in its upcoming report. Get prepared with the key expectations. |
CRI Price Returns
1-mo | -7.87% |
3-mo | -20.23% |
6-mo | -29.13% |
1-year | -30.93% |
3-year | -20.75% |
5-year | -13.84% |
YTD | -29.13% |
2021 | 9.06% |
2020 | -13.41% |
2019 | 36.84% |
2018 | -29.33% |
2017 | 38.29% |
CRI Dividends
Ex-Dividend Date | Type | Payout Amount | Change | ||||||
---|---|---|---|---|---|---|---|---|---|
Loading, please wait... |
Continue Researching CRI
Want to do more research on Carters Inc's stock and its price? Try the links below:Carters Inc (CRI) Stock Price | Nasdaq
Carters Inc (CRI) Stock Quote, History and News - Yahoo Finance
Carters Inc (CRI) Stock Price and Basic Information | MarketWatch
Loading social stream, please wait...