
Crocs, Inc. (CROX): Price and Financial Metrics
CROX Price/Volume Stats
| Current price | $130.50 | 52-week high | $165.32 |
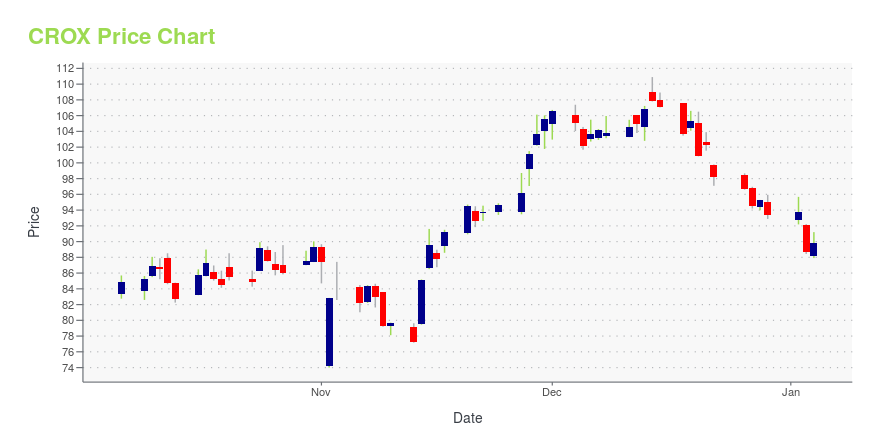
| Prev. close | $125.14 | 52-week low | $74.00 |
| Day low | $129.21 | Volume | 1,876,052 |
| Day high | $133.64 | Avg. volume | 1,346,044 |
| 50-day MA | $145.70 | Dividend yield | N/A |
| 200-day MA | $118.52 | Market Cap | 7.92B |
CROX Stock Price Chart Interactive Chart >
Crocs, Inc. (CROX) Company Bio
Crocs Inc. designs and manufactures footwear products including sandals, sneakers, mules, and flats and boots. The company was founded in 1999 and is based in Niwot, Colorado.
Latest CROX News From Around the Web
Below are the latest news stories about CROCS INC that investors may wish to consider to help them evaluate CROX as an investment opportunity.
Crocs, Inc. Appoints Industry Leaders John Replogle and Neeraj Tolmare to Board of DirectorsCrocs, Inc. (NASDAQ: CROX), a global leader in innovative casual footwear for all, today announced that John Replogle and Neeraj Tolmare have both been appointed to its board of directors, effective January 1, 2024. The new appointees will bring new skill sets and extensive brand building experience in consumer facing businesses to the Crocs board. |
Bank of America Pounds the Table on These 3 Buy-Rated StocksIt’s safe to say now that stock investors are finishing 2023 in a pretty happy mood. We saw large gains in the markets, and even the late-summer swoon has been fully offset by November’s bullish turn, still in play six weeks later. At the start of this year, Bank of America set a year-end target for the S&P 500 at 4,600. The index has surpassed that, and BofA’s equity strategy team is predicting it will hit 5,000 by the end of next year. Commenting on the markets, Savita Subramanian, the bank’s |
Headed Into 2024, These 5 Stocks Make Up 40% of My Retirement Portfolio. Here's Why I Don't Plan to Change a Thing.When flowers are blooming, you leave them planted in the garden to continue growing. |
Insider Sell: EVP Adam Michaels Sells Shares of Crocs IncAdam Michaels, the Executive Vice President and Chief Digital Officer of Crocs Inc (NASDAQ:CROX), has recently sold 3,872 shares of the company's stock. |
Crocs Stock (NASDAQ:CROX): The Rebound Has Only Just BegunCrocs stock (NASDAQ:CROX) is currently undergoing a strong rebound, with shares trading 41% higher from last month’s lows of about $74. Despite the strong rally over the past month, I believe that Crocs’ rebound has only just begun. The company’s results remain exceptionally strong, progress toward deleveraging has exceeded expectations, and management has resumed share repurchases. Coupled with the fact that shares appear to be trading at an attractive valuation, my bullish view of CROX is inta |
CROX Price Returns
| 1-mo | -12.20% |
| 3-mo | 4.07% |
| 6-mo | 26.75% |
| 1-year | 27.57% |
| 3-year | 1.41% |
| 5-year | 451.33% |
| YTD | 39.71% |
| 2023 | -13.85% |
| 2022 | -15.43% |
| 2021 | 104.63% |
| 2020 | 49.58% |
| 2019 | 61.24% |
Continue Researching CROX
Here are a few links from around the web to help you further your research on Crocs Inc's stock as an investment opportunity:Crocs Inc (CROX) Stock Price | Nasdaq
Crocs Inc (CROX) Stock Quote, History and News - Yahoo Finance
Crocs Inc (CROX) Stock Price and Basic Information | MarketWatch
Loading social stream, please wait...