
Carpenter Technology Corporation (CRS): Price and Financial Metrics
CRS Price/Volume Stats
| Current price | $279.58 | 52-week high | $282.99 |
| Prev. close | $275.05 | 52-week low | $104.02 |
| Day low | $275.82 | Volume | 626,200 |
| Day high | $282.99 | Avg. volume | 921,978 |
| 50-day MA | $236.01 | Dividend yield | 0.29% |
| 200-day MA | $192.92 | Market Cap | 13.92B |
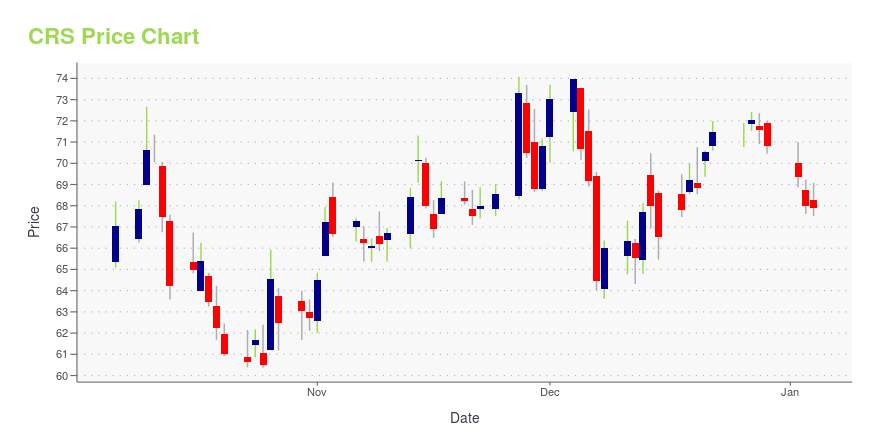
CRS Stock Price Chart Interactive Chart >
Carpenter Technology Corporation (CRS) Company Bio
Carpenter Technology Corporation produces and distributes specialty alloys, including stainless steels, titanium alloys and superalloys, and various engineered products. The company was founded in 1889 and is based in Wyomissing, Pennsylvania.
CRS Price Returns
| 1-mo | 13.37% |
| 3-mo | 84.57% |
| 6-mo | 55.55% |
| 1-year | N/A |
| 3-year | 1,010.00% |
| 5-year | N/A |
| YTD | 65.10% |
| 2024 | 141.72% |
| 2023 | 94.48% |
| 2022 | 29.50% |
| 2021 | 2.66% |
| 2020 | -39.44% |
CRS Dividends
| Ex-Dividend Date | Type | Payout Amount | Change | ||||||
|---|---|---|---|---|---|---|---|---|---|
| Loading, please wait... | |||||||||
Continue Researching CRS
Want to do more research on Carpenter Technology Corp's stock and its price? Try the links below:Carpenter Technology Corp (CRS) Stock Price | Nasdaq
Carpenter Technology Corp (CRS) Stock Quote, History and News - Yahoo Finance
Carpenter Technology Corp (CRS) Stock Price and Basic Information | MarketWatch
Loading social stream, please wait...