Carpenter Technology Corporation (CRS): Price and Financial Metrics
CRS Price/Volume Stats
Current price | $66.00 | 52-week high | $74.06 |
Prev. close | $64.46 | 52-week low | $35.72 |
Day low | $63.61 | Volume | 594,300 |
Day high | $66.36 | Avg. volume | 434,541 |
50-day MA | $66.70 | Dividend yield | 1.16% |
200-day MA | $56.44 | Market Cap | 3.25B |
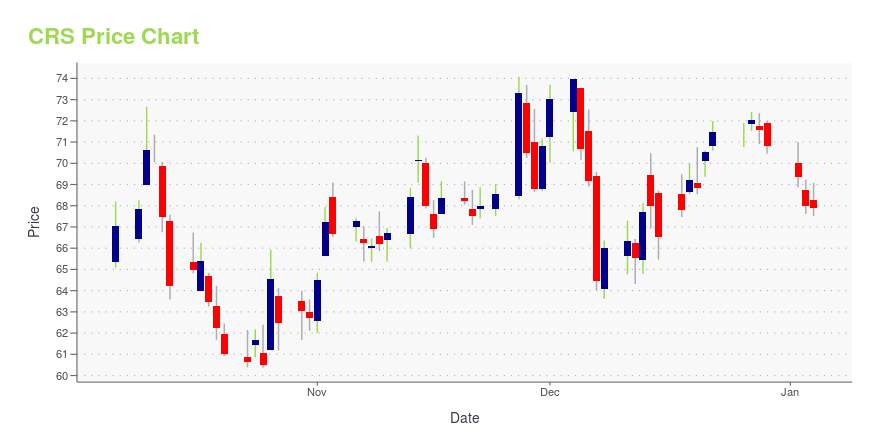
CRS Stock Price Chart Interactive Chart >
CRS POWR Grades
- Growth is the dimension where CRS ranks best; there it ranks ahead of 97.68% of US stocks.
- The strongest trend for CRS is in Quality, which has been heading up over the past 177 days.
- CRS ranks lowest in Value; there it ranks in the 10th percentile.
CRS Stock Summary
- CRS's one year PEG ratio, measuring expected growth in earnings next year relative to current common stock price is 0.29 -- higher than just 3.61% of US-listed equities with positive expected earnings growth.
- CRS's went public 36.11 years ago, making it older than 90.99% of listed US stocks we're tracking.
- Over the past twelve months, CRS has reported earnings growth of 11,575%, putting it ahead of 99.88% of US stocks in our set.
- Stocks with similar financial metrics, market capitalization, and price volatility to CARPENTER TECHNOLOGY CORP are BB, NCSM, KUKE, CATO, and TTWO.
- Visit CRS's SEC page to see the company's official filings. To visit the company's web site, go to www.carpentertechnology.com.
CRS Valuation Summary
- CRS's price/sales ratio is 1.3; this is 8.33% higher than that of the median Industrials stock.
- Over the past 243 months, CRS's price/earnings ratio has gone down 1031.4.
Below are key valuation metrics over time for CRS.
Stock | Date | P/S | P/B | P/E | EV/EBIT |
---|---|---|---|---|---|
CRS | 2023-11-30 | 1.3 | 2.4 | 32.6 | 22.3 |
CRS | 2023-11-29 | 1.3 | 2.4 | 31.7 | 21.8 |
CRS | 2023-11-28 | 1.3 | 2.4 | 32.5 | 22.2 |
CRS | 2023-11-27 | 1.3 | 2.5 | 33.7 | 23.0 |
CRS | 2023-11-24 | 1.3 | 2.4 | 31.6 | 21.7 |
CRS | 2023-11-22 | 1.3 | 2.3 | 31.3 | 21.6 |
CRS Growth Metrics
- The 2 year net income to common stockholders growth rate now stands at -164.45%.
- The year over year net income to common stockholders growth rate now stands at 62.6%.
- Its 4 year net cashflow from operations growth rate is now at 74.03%.

The table below shows CRS's growth in key financial areas (numbers in millions of US dollars).
Date | Revenue | Operating Cash Flow | Net Income to Common Stock |
---|---|---|---|
2022-12-31 | 2,154.7 | -22.2 | -5.6 |
2022-09-30 | 1,971.6 | -25 | -41.2 |
2022-06-30 | 1,836.3 | 6 | -49.1 |
2022-03-31 | 1,694.2 | -26.4 | -108.8 |
2021-12-31 | 1,557.1 | -57.9 | -141.8 |
2021-09-30 | 1,509.9 | 115 | -197.3 |
CRS's Quality Factors
The “Quality” component of the POWR Ratings focuses on 31 different factors of a companies fundamentals and operational strength. Here are some key insights as we drill into the specifics of these quality attributes.- CRS has a Quality Grade of C, ranking ahead of 52.67% of graded US stocks.
- CRS's asset turnover comes in at 0.486 -- ranking 34th of 41 Steel Works Etc stocks.
- WOR, BOOM, and ATI are the stocks whose asset turnover ratios are most correlated with CRS.
The table below shows CRS's key quality metrics over time.
Period | Asset Turnover | Gross Margin | ROIC |
---|---|---|---|
2021-06-30 | 0.486 | 0.001 | -0.091 |
2021-03-31 | 0.481 | 0.011 | -0.112 |
2020-12-31 | 0.538 | 0.066 | -0.076 |
2020-09-30 | 0.591 | 0.113 | -0.028 |
2020-06-30 | 0.651 | 0.151 | 0.008 |
2020-03-31 | 0.714 | 0.192 | 0.077 |
CRS Price Target
For more insight on analysts targets of CRS, see our CRS price target page. And for a list of of all stocks sorted by upside potential based on analyst target price, see our Top Price Target page.
Average Price Target | $45.33 | Average Broker Recommendation | 1.8 (Moderate Buy) |
Carpenter Technology Corporation (CRS) Company Bio
Carpenter Technology Corporation produces and distributes specialty alloys, including stainless steels, titanium alloys and superalloys, and various engineered products. The company was founded in 1889 and is based in Wyomissing, Pennsylvania.
Latest CRS News From Around the Web
Below are the latest news stories about CARPENTER TECHNOLOGY CORP that investors may wish to consider to help them evaluate CRS as an investment opportunity.
The Returns At Carpenter Technology (NYSE:CRS) Aren't GrowingIf we want to find a stock that could multiply over the long term, what are the underlying trends we should look for... |
Why Carpenter Technology (CRS) is a Top Momentum Stock for the Long-TermWhether you're a value, growth, or momentum investor, finding strong stocks becomes easier with the Zacks Style Scores, a top feature of the Zacks Premium research service. |
Can Carpenter Technology Put the Pedal to the Metal?The trading volume has been more active the past three months while the daily On-Balance-Volume (OBV) line has leveled off. In this daily Point and Figure chart of CRS, below, I can see an upside price target in the $83 area. In this weekly Point and Figure chart of CRS, below, a price target of $81 is shown. |
Carpenter Technology Names Brian Malloy Chief Operating OfficerPHILADELPHIA, Nov. 28, 2023 (GLOBE NEWSWIRE) -- Carpenter Technology Corporation announced Brian Malloy has been named Senior Vice President and Chief Operating Officer, effective December 4, 2023. In this position, Mr. Malloy will expand his responsibilities and oversee the operations of Carpenter Technology’s Specialty Alloys Operations (SAO) and Performance Engineered Products (PEP) business segments. He will continue to report directly to Tony Thene, President and Chief Executive Officer. Mr |
Dow Jones Futures Fall: Market Rally Looks Great, But Beware This; 8 Stocks Near Buy PointsThe market rally continues its strong November run, but a key fear gauge raises some concerns. Weight-loss drug giant Novo Nordisk broke out Friday, leading stocks to watch. |
CRS Price Returns
1-mo | -1.06% |
3-mo | 3.53% |
6-mo | 26.37% |
1-year | 70.32% |
3-year | 145.57% |
5-year | 87.46% |
YTD | 81.30% |
2022 | 29.50% |
2021 | 2.66% |
2020 | -39.44% |
2019 | 42.12% |
2018 | -29.16% |
CRS Dividends
Ex-Dividend Date | Type | Payout Amount | Change | ||||||
---|---|---|---|---|---|---|---|---|---|
Loading, please wait... |
Continue Researching CRS
Want to do more research on Carpenter Technology Corp's stock and its price? Try the links below:Carpenter Technology Corp (CRS) Stock Price | Nasdaq
Carpenter Technology Corp (CRS) Stock Quote, History and News - Yahoo Finance
Carpenter Technology Corp (CRS) Stock Price and Basic Information | MarketWatch
Loading social stream, please wait...