Citi Trends, Inc. (CTRN): Price and Financial Metrics
GET POWR RATINGS... FREE!
CTRN POWR Grades
- CTRN scores best on the Value dimension, with a Value rank ahead of 99.18% of US stocks.
- The strongest trend for CTRN is in Value, which has been heading up over the past 179 days.
- CTRN's current lowest rank is in the Sentiment metric (where it is better than 3.89% of US stocks).
CTRN Stock Summary
- Citi Trends Inc's capital turnover -- a measure of revenue relative to shareholder's equity -- is better than 96.76% of US listed stocks.
- With a price/earnings ratio of 4.38, Citi Trends Inc P/E ratio is greater than that of about only 4.95% of stocks in our set with positive earnings.
- Citi Trends Inc's shareholder yield -- a measure of how much capital is returned to stockholders via dividends and buybacks -- is 40.28%, greater than the shareholder yield of 96.13% of stocks in our set.
- Stocks that are quantitatively similar to CTRN, based on their financial statements, market capitalization, and price volatility, are SGRP, CAL, MED, LFVN, and SFM.
- Visit CTRN's SEC page to see the company's official filings. To visit the company's web site, go to www.cititrends.com.
CTRN Valuation Summary
- CTRN's EV/EBIT ratio is 8.7; this is 47.9% lower than that of the median Consumer Cyclical stock.
- Over the past 198 months, CTRN's EV/EBIT ratio has gone down 5.6.
- CTRN's price/earnings ratio has moved down 15.4 over the prior 198 months.
Below are key valuation metrics over time for CTRN.
Stock | Date | P/S | P/B | P/E | EV/EBIT |
---|---|---|---|---|---|
CTRN | 2021-08-27 | 0.8 | 5.4 | 10.5 | 8.7 |
CTRN | 2021-08-26 | 0.8 | 5.2 | 10.2 | 8.5 |
CTRN | 2021-08-25 | 0.8 | 5.4 | 10.5 | 8.7 |
CTRN | 2021-08-24 | 0.8 | 5.3 | 10.3 | 8.6 |
CTRN | 2021-08-23 | 0.8 | 5.0 | 9.7 | 8.1 |
CTRN | 2021-08-20 | 0.7 | 4.8 | 9.3 | 7.8 |
CTRN Growth Metrics
- The 3 year price growth rate now stands at -8.23%.
- Its 4 year revenue growth rate is now at 1.53%.
- The 5 year price growth rate now stands at -3.92%.

The table below shows CTRN's growth in key financial areas (numbers in millions of US dollars).
Date | Revenue | Operating Cash Flow | Net Income to Common Stock |
---|---|---|---|
2021-09-30 | 1,002.54 | 102.668 | 70.439 |
2021-06-30 | 973.681 | 112.271 | 68.39 |
2021-03-31 | 952.551 | 159.777 | 75.767 |
2020-12-31 | 783.294 | 110.858 | 23.978 |
2020-09-30 | 742.388 | 84.541 | 15.362 |
2020-06-30 | 726.338 | 77.936 | 7.313 |
CTRN's Quality Factors
The “Quality” component of the POWR Ratings focuses on 31 different factors of a companies fundamentals and operational strength. Here are some key insights as we drill into the specifics of these quality attributes.- CTRN has a Quality Grade of A, ranking ahead of 97.8% of graded US stocks.
- CTRN's asset turnover comes in at 1.965 -- ranking 51st of 165 Retail stocks.
- WSM, AAP, and SCVL are the stocks whose asset turnover ratios are most correlated with CTRN.
The table below shows CTRN's key quality metrics over time.
Period | Asset Turnover | Gross Margin | ROIC |
---|---|---|---|
2021-07-31 | 1.965 | 0.420 | 0.223 |
2021-05-01 | 1.918 | 0.422 | 0.248 |
2021-01-30 | 1.595 | 0.398 | 0.077 |
2020-10-31 | 1.540 | 0.388 | 0.046 |
2020-08-01 | 1.538 | 0.376 | 0.022 |
2020-05-02 | 1.510 | 0.364 | -0.036 |
CTRN Price Target
For more insight on analysts targets of CTRN, see our CTRN price target page. And for a list of of all stocks sorted by upside potential based on analyst target price, see our Top Price Target page.
Average Price Target | $136.67 | Average Broker Recommendation | 1.33 (Strong Buy) |
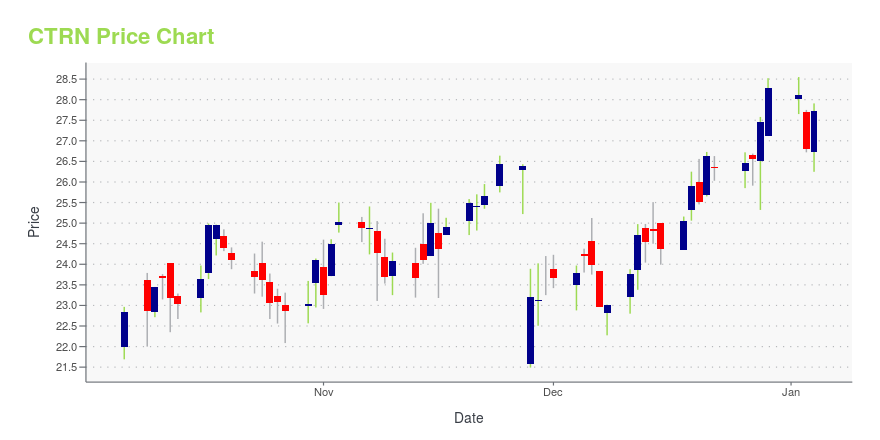
CTRN Stock Price Chart Interactive Chart >
CTRN Price/Volume Stats
Current price | $23.94 | 52-week high | $97.46 |
Prev. close | $24.31 | 52-week low | $21.70 |
Day low | $23.21 | Volume | 248,400 |
Day high | $24.11 | Avg. volume | 525,620 |
50-day MA | $27.75 | Dividend yield | N/A |
200-day MA | $53.50 | Market Cap | 200.98M |
Citi Trends, Inc. (CTRN) Company Bio
Citi Trends operates as a retailer of urban fashion apparel and accessories. The company was founded in 1946 and is based in Savannah, Georgia.
Latest CTRN News From Around the Web
Below are the latest news stories about Citi Trends Inc that investors may wish to consider to help them evaluate CTRN as an investment opportunity.
Citi Trends (CTRN) Stock Sinks As Market Gains: What You Should KnowCiti Trends (CTRN) closed the most recent trading day at $46.03, moving -1.92% from the previous trading session. |
New Strong Sell Stocks for February 16thNLY, GNK, and CTRN have been added to the Zacks Rank #5 (Strong Sell) List on February 16, 2022 |
New Strong Sell Stocks for February 10thCTRN, KMT, and LEG have been added to the Zacks Rank #5 (Strong Sell) List on February 10, 2022 |
Citi Trends (CTRN) Gains But Lags Market: What You Should KnowIn the latest trading session, Citi Trends (CTRN) closed at $45.84, marking a +1.37% move from the previous day. |
Boot Barn (BOOT) Q3 Earnings Miss, Revenues Increase Y/YBoot Barn Holdings (BOOT) third-quarter fiscal 2022 results reflect strong full-price selling and growth in exclusive brand penetration. |
CTRN Price Returns
1-mo | -19.88% |
3-mo | -16.29% |
6-mo | -74.73% |
1-year | -72.48% |
3-year | 68.24% |
5-year | 17.74% |
YTD | -74.73% |
2021 | 90.72% |
2020 | 115.75% |
2019 | 15.46% |
2018 | -21.94% |
2017 | 42.63% |
Continue Researching CTRN
Want to do more research on Citi Trends Inc's stock and its price? Try the links below:Citi Trends Inc (CTRN) Stock Price | Nasdaq
Citi Trends Inc (CTRN) Stock Quote, History and News - Yahoo Finance
Citi Trends Inc (CTRN) Stock Price and Basic Information | MarketWatch
Loading social stream, please wait...