
DoorDash Inc. Cl A (DASH): Price and Financial Metrics
DASH Price/Volume Stats
| Current price | $104.74 | 52-week high | $143.34 |
| Prev. close | $100.78 | 52-week low | $69.90 |
| Day low | $102.81 | Volume | 4,026,241 |
| Day high | $106.65 | Avg. volume | 3,972,739 |
| 50-day MA | $109.93 | Dividend yield | N/A |
| 200-day MA | $109.53 | Market Cap | 42.83B |
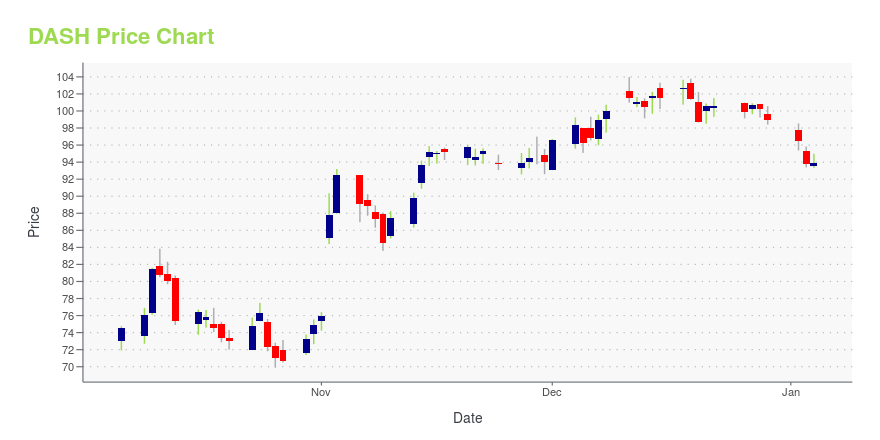
DASH Stock Price Chart Interactive Chart >
DoorDash Inc. Cl A (DASH) Company Bio
DoorDash, Inc. is an American company that operates an online food ordering and food delivery platform. The company is based in San Francisco, California. It went public in December 2020 on NYSE and trades under the symbol DASH. (Source:Wikipedia)
Latest DASH News From Around the Web
Below are the latest news stories about DOORDASH INC that investors may wish to consider to help them evaluate DASH as an investment opportunity.
Take Profit: 3 Stocks to Sell That Are Up More Than 100% in 2023Maximize your profits and minimize your risks by cleaning your portfolio of these overvalued stocks. |
Should You Think About Buying DoorDash, Inc. (NASDAQ:DASH) Now?Today we're going to take a look at the well-established DoorDash, Inc. ( NASDAQ:DASH ). The company's stock received a... |
7 Growth Stocks to Avoid No Matter WhatGrowth stocks are looking much stronger as the Fed eases its rate hikes but not everything is buyworthy on rate cut news. |
Uber, DoorDash to make tipping harder for NYC customersAccording to Bloomberg report, Uber Eats (UBER) and DoorDash (DASH) have made changes to their respective apps to make it more difficult to tip drivers after a NYC wage law went into effect on December 4th. The new base rate is $17.96 an hour for the drivers, who are saying the tipping change could cause them to earn less in the long run. Yahoo Finance Anchors Julie Hyman and Josh Lipton break down the latest from this development and what it could mean for the companies and workers going forward. For more expert insight and the latest market action, click here to watch this full episode of Yahoo Finance Live. |
Fate of pandemic darling stocks: DoorDash is taking off while Zoom remains in limboWhile some companies have translated their pandemic-era growth into long-term success, others face a murky future. |
DASH Price Returns
| 1-mo | -5.71% |
| 3-mo | -20.72% |
| 6-mo | -3.23% |
| 1-year | 21.73% |
| 3-year | -41.81% |
| 5-year | N/A |
| YTD | 5.92% |
| 2023 | 102.56% |
| 2022 | -67.21% |
| 2021 | 4.31% |
| 2020 | N/A |
| 2019 | N/A |
Loading social stream, please wait...