Designer Brands Inc. (DBI): Price and Financial Metrics
GET POWR RATINGS... FREE!
DBI POWR Grades
- DBI scores best on the Value dimension, with a Value rank ahead of 93.21% of US stocks.
- DBI's strongest trending metric is Sentiment; it's been moving down over the last 177 days.
- DBI's current lowest rank is in the Sentiment metric (where it is better than 9.24% of US stocks).
DBI Stock Summary
- DESIGNER BRANDS INC's capital turnover -- a measure of revenue relative to shareholder's equity -- is better than 96.13% of US listed stocks.
- DBI's current price/earnings ratio is 5.38, which is higher than merely 11% of US stocks with positive earnings.
- DBI's price/sales ratio is 0.21; that's higher than the P/S ratio of only 4.42% of US stocks.
- Stocks that are quantitatively similar to DBI, based on their financial statements, market capitalization, and price volatility, are HBB, ARHS, CAL, BBSI, and AEY.
- DBI's SEC filings can be seen here. And to visit DESIGNER BRANDS INC's official web site, go to www.designerbrands.com.
DBI Valuation Summary
- DBI's price/sales ratio is 0.2; this is 89.47% lower than that of the median Consumer Cyclical stock.
- Over the past 214 months, DBI's price/sales ratio has gone down 0.8.
Below are key valuation metrics over time for DBI.
Stock | Date | P/S | P/B | P/E | EV/EBIT |
---|---|---|---|---|---|
DBI | 2023-01-26 | 0.2 | 1.7 | 5.0 | 9.4 |
DBI | 2023-01-25 | 0.2 | 1.7 | 5.0 | 9.4 |
DBI | 2023-01-24 | 0.2 | 1.6 | 4.7 | 9.2 |
DBI | 2023-01-23 | 0.2 | 1.6 | 4.8 | 9.3 |
DBI | 2023-01-20 | 0.2 | 1.6 | 4.6 | 9.1 |
DBI | 2023-01-19 | 0.2 | 1.5 | 4.5 | 9.1 |
DBI Growth Metrics
- Its 5 year price growth rate is now at -60.33%.
- Its 5 year net income to common stockholders growth rate is now at -229.85%.
- Its year over year net cashflow from operations growth rate is now at 214.21%.

The table below shows DBI's growth in key financial areas (numbers in millions of US dollars).
Date | Revenue | Operating Cash Flow | Net Income to Common Stock |
---|---|---|---|
2022-09-30 | 3,377.508 | 45.075 | 131.977 |
2022-06-30 | 3,365.955 | 86.064 | 166.99 |
2022-03-31 | 3,323.971 | 132.113 | 163.637 |
2021-12-31 | 3,196.583 | 171.429 | 154.481 |
2021-09-30 | 2,983.309 | 116.834 | 6.066 |
2021-06-30 | 2,782.712 | 22.055 | -114.761 |
DBI's Quality Factors
The “Quality” component of the POWR Ratings focuses on 31 different factors of a companies fundamentals and operational strength. Here are some key insights as we drill into the specifics of these quality attributes.- DBI has a Quality Grade of C, ranking ahead of 57.62% of graded US stocks.
- DBI's asset turnover comes in at 1.36 -- ranking 90th of 165 Retail stocks.
- BBY, ULTA, and BURL are the stocks whose asset turnover ratios are most correlated with DBI.
The table below shows DBI's key quality metrics over time.
Period | Asset Turnover | Gross Margin | ROIC |
---|---|---|---|
2021-07-31 | 1.360 | 0.288 | -0.020 |
2021-05-01 | 1.154 | 0.226 | -0.100 |
2021-01-30 | 1.003 | 0.139 | -0.229 |
2020-10-31 | 1.039 | 0.152 | -0.196 |
2020-08-01 | 1.123 | 0.176 | -0.147 |
2020-05-02 | 1.239 | 0.229 | -0.082 |
DBI Price Target
For more insight on analysts targets of DBI, see our DBI price target page. And for a list of of all stocks sorted by upside potential based on analyst target price, see our Top Price Target page.
Average Price Target | $19.00 | Average Broker Recommendation | 1.92 (Hold) |
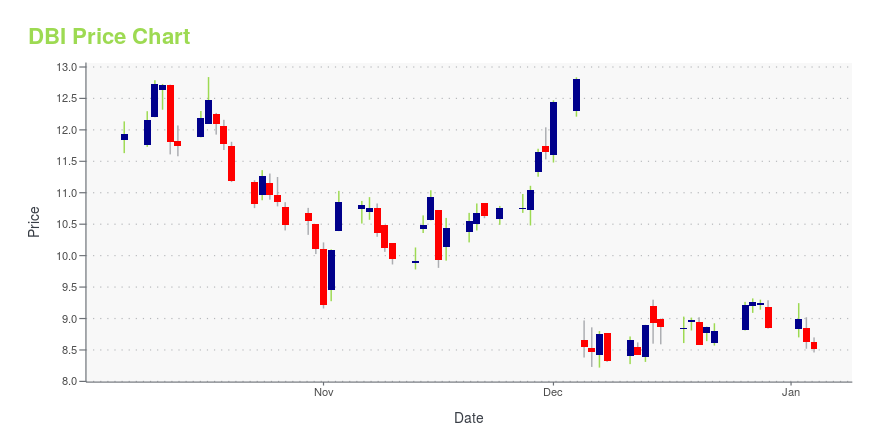
DBI Stock Price Chart Interactive Chart >
DBI Price/Volume Stats
Current price | $10.94 | 52-week high | $19.38 |
Prev. close | $11.15 | 52-week low | $8.90 |
Day low | $10.86 | Volume | 1,480,000 |
Day high | $11.24 | Avg. volume | 1,924,400 |
50-day MA | $10.62 | Dividend yield | 1.83% |
200-day MA | $14.00 | Market Cap | 696.13M |
Designer Brands Inc. (DBI) Company Bio
Designer Brands (formerly DSW Inc.) is a branded footwear and accessories retailer that offers a wide selection of brand name and designer dress, casual and athletic footwear and accessories for women, men and kids. The company was founded in 1917 and is based in Columbus, Ohio.
Latest DBI News From Around the Web
Below are the latest news stories about DESIGNER BRANDS INC that investors may wish to consider to help them evaluate DBI as an investment opportunity.
New Strong Sell Stocks for January 9thADTN, AVAH and DBI have been added to the Zacks Rank #5 (Strong Sell) List on January 9, 2023. |
My 'Dandy Dozen' of Top Dollar Stock Holdings at the Start of 2023The list is a snapshot of my largest 12 by dollar value as of Tuesday. The only stock down less than 20% from its 2021-2022 peak is Berry Global . BERY is a proven "left to right" growth company at what is still a bargain valuation. |
Kohl’s Corp. general counsel Jason Kelroy to depart retailerKohl’s Corp. general counsel and corporate secretary Jason Kelroy plans to leave the business this month. Kelroy said in a post on LinkedIn that he told Kohl’s (NYSE: KSS) last summer of his intent to step down at the end of the fiscal year, which this year is Jan. 28. “As I begin my last full month at Kohl’s, I want to express my profound gratitude to every member of the Kohl’s legal team, past and present – as well as to all of my business partners – that made our many accomplishments over the past two decades possible,” Kelroy said in his announcement. |
Designer Brands CEO Roger Rawlins stepping down, DSW president stepping upThe parent company of DSW is set to welcome a new CEO. Columbus-based Designer Brands Inc. Thursday announced that CEO Roger Rawlins will step down from that role as well as from the board of directors on April 1. Doug Howe, currently president of the DSW chain, will take over those duties. |
Footwear retailer Designer Brands names DSW President Doug Howe as CEO, backs 2022 guidanceFootwear retailer Designer Brands Inc. (DBI) said Thursday its board has named Doug Howe, currently president of DSW, to succeed Roger Rawlins as chief executive, effective April 1. Howe has more than 30 years of experience in the retail industry and has been president of DSW since May of 2022, joining from Kohl’s Inc. (KSS) where he was chief merchandising officer. The parent of DSW and The Shoe Company reaffirmed its 2022 guidance for same-store sales growth in the mid-single digits and EPS of $1.75 to $1.80. |
DBI Price Returns
1-mo | 14.32% |
3-mo | -27.53% |
6-mo | -32.09% |
1-year | -8.83% |
3-year | -26.54% |
5-year | -35.71% |
YTD | 11.86% |
2022 | -30.14% |
2021 | 85.75% |
2020 | -50.65% |
2019 | -32.63% |
2018 | 20.02% |
DBI Dividends
Ex-Dividend Date | Type | Payout Amount | Change | ||||||
---|---|---|---|---|---|---|---|---|---|
Loading, please wait... |
Continue Researching DBI
Here are a few links from around the web to help you further your research on Designer Brands Inc's stock as an investment opportunity:Designer Brands Inc (DBI) Stock Price | Nasdaq
Designer Brands Inc (DBI) Stock Quote, History and News - Yahoo Finance
Designer Brands Inc (DBI) Stock Price and Basic Information | MarketWatch
Loading social stream, please wait...