Deckers Outdoor Corporation (DECK): Price and Financial Metrics
GET POWR RATINGS... FREE!
DECK Price/Volume Stats
Current price | $465.18 | 52-week high | $503.48 |
Prev. close | $450.01 | 52-week low | $238.43 |
Day low | $424.36 | Volume | 1,344,800 |
Day high | $472.23 | Avg. volume | 386,762 |
50-day MA | $464.91 | Dividend yield | N/A |
200-day MA | $395.94 | Market Cap | 12.26B |
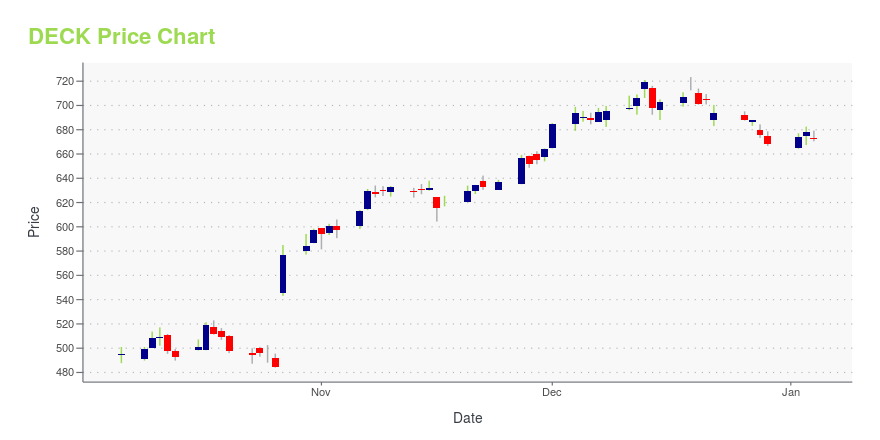
DECK Stock Price Chart Interactive Chart >
DECK POWR Grades
- Quality is the dimension where DECK ranks best; there it ranks ahead of 94.24% of US stocks.
- DECK's strongest trending metric is Quality; it's been moving up over the last 179 days.
- DECK's current lowest rank is in the Value metric (where it is better than 23.96% of US stocks).
DECK Stock Summary
- DECK has a market capitalization of $11,606,772,075 -- more than approximately 86.03% of US stocks.
- The price/operating cash flow metric for DECKERS OUTDOOR CORP is higher than 84.01% of stocks in our set with a positive cash flow.
- Of note is the ratio of DECKERS OUTDOOR CORP's sales and general administrative expense to its total operating expenses; 87.44% of US stocks have a lower such ratio.
- If you're looking for stocks that are quantitatively similar to DECKERS OUTDOOR CORP, a group of peers worth examining would be WSO, TTC, FND, SNA, and DCI.
- DECK's SEC filings can be seen here. And to visit DECKERS OUTDOOR CORP's official web site, go to www.deckers.com.
DECK Valuation Summary
- In comparison to the median Consumer Cyclical stock, DECK's price/sales ratio is 325% higher, now standing at 3.4.
- Over the past 243 months, DECK's price/earnings ratio has gone up 8.6.
Below are key valuation metrics over time for DECK.
Stock | Date | P/S | P/B | P/E | EV/EBIT |
---|---|---|---|---|---|
DECK | 2023-05-19 | 3.4 | 6.8 | 24.3 | 17.5 |
DECK | 2023-05-18 | 3.5 | 7.0 | 25.2 | 18.2 |
DECK | 2023-05-17 | 3.5 | 7.0 | 25.1 | 18.1 |
DECK | 2023-05-16 | 3.5 | 7.1 | 25.3 | 18.3 |
DECK | 2023-05-15 | 3.6 | 7.3 | 26.2 | 19.0 |
DECK | 2023-05-12 | 3.6 | 7.3 | 26.2 | 19.0 |
DECK Growth Metrics
- Its 4 year net cashflow from operations growth rate is now at 44.12%.
- The 2 year revenue growth rate now stands at 47.72%.
- Its 4 year net income to common stockholders growth rate is now at 4736.11%.

The table below shows DECK's growth in key financial areas (numbers in millions of US dollars).
Date | Revenue | Operating Cash Flow | Net Income to Common Stock |
---|---|---|---|
2022-12-31 | 3,571.722 | 422.866 | 493.854 |
2022-09-30 | 3,413.834 | 108.181 | 448.135 |
2022-06-30 | 3,260.122 | 179.764 | 448.674 |
2022-03-31 | 3,150.339 | 172.353 | 451.949 |
2021-12-31 | 2,975.52 | 301.325 | 416.588 |
2021-09-30 | 2,865.527 | 439.504 | 439.181 |
DECK's Quality Factors
The “Quality” component of the POWR Ratings focuses on 31 different factors of a companies fundamentals and operational strength. Here are some key insights as we drill into the specifics of these quality attributes.- DECK has a Quality Grade of A, ranking ahead of 96.92% of graded US stocks.
- DECK's asset turnover comes in at 1.244 -- ranking 9th of 32 Apparel stocks.
- LULU, GES, and PVH are the stocks whose asset turnover ratios are most correlated with DECK.
The table below shows DECK's key quality metrics over time.
Period | Asset Turnover | Gross Margin | ROIC |
---|---|---|---|
2021-06-30 | 1.244 | 0.539 | 0.624 |
2021-03-31 | 1.204 | 0.540 | 0.534 |
2020-12-31 | 1.172 | 0.538 | 0.462 |
2020-09-30 | 1.176 | 0.523 | 0.376 |
2020-06-30 | 1.189 | 0.522 | 0.337 |
2020-03-31 | 1.202 | 0.518 | 0.316 |
Deckers Outdoor Corporation (DECK) Company Bio
Deckers Outdoor Corporaton designs, markets, and distributes footwear, apparel, and accessories for casual lifestyle use and high performance activities. The Company markets its products under three brands: UGG, Teva, and Sanuk. The company was founded in 1973 and is based in Goleta, California.
Latest DECK News From Around the Web
Below are the latest news stories about DECKERS OUTDOOR CORP that investors may wish to consider to help them evaluate DECK as an investment opportunity.
Deckers Outdoor Q4 2023 Earnings Preview
|
Will Deckers (DECK) Beat Estimates Again in Its Next Earnings Report?Deckers (DECK) has an impressive earnings surprise history and currently possesses the right combination of the two key ingredients for a likely beat in its next quarterly report. |
Kohl's (KSS) Set to Report Q1 Earnings: What Should You Know?Kohl's (KSS) first-quarter results are likely to reflect the impacts of a tough macroeconomic landscape, including inflation. However, a focus on growing the store and online business bodes well. |
V.F. Corp. (VFC) to Report Q4 Earnings: Is a Beat in Store?V.F. Corp's (VFC) Q4 results are expected to reflect gains from the Supreme buyout and other strategic actions. However, supply-chain headwinds and lower consumer spending are likely to have ailed. |
Why Earnings Season Could Be Great for Deckers (DECK)Deckers (DECK) is seeing favorable earnings estimate revision activity and has a positive Zacks Earnings ESP heading into earnings season. |
DECK Price Returns
1-mo | -2.95% |
3-mo | 11.73% |
6-mo | 16.62% |
1-year | 71.12% |
3-year | 154.85% |
5-year | 322.89% |
YTD | 16.54% |
2022 | 8.97% |
2021 | 27.73% |
2020 | 69.83% |
2019 | 31.97% |
2018 | 59.44% |
Continue Researching DECK
Here are a few links from around the web to help you further your research on Deckers Outdoor Corp's stock as an investment opportunity:Deckers Outdoor Corp (DECK) Stock Price | Nasdaq
Deckers Outdoor Corp (DECK) Stock Quote, History and News - Yahoo Finance
Deckers Outdoor Corp (DECK) Stock Price and Basic Information | MarketWatch
Loading social stream, please wait...