
DHI Group, Inc. (DHX): Price and Financial Metrics
DHX Price/Volume Stats
| Current price | $3.02 | 52-week high | $3.34 |
| Prev. close | $3.25 | 52-week low | $1.21 |
| Day low | $3.01 | Volume | 116,100 |
| Day high | $3.26 | Avg. volume | 156,595 |
| 50-day MA | $2.20 | Dividend yield | N/A |
| 200-day MA | $2.00 | Market Cap | 147.23M |
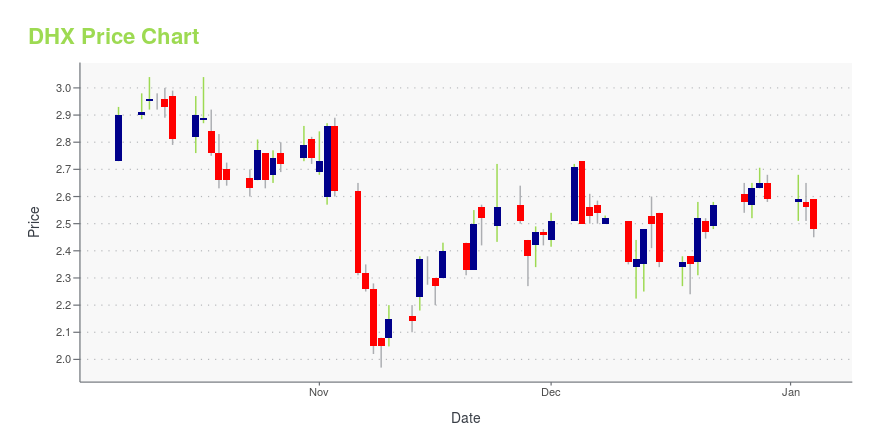
DHX Stock Price Chart Interactive Chart >
DHI Group, Inc. (DHX) Company Bio
DHI Group is a provider of specialized websites and services for professional communities including technology and security clearance, financial services, energy, healthcare and hospitality. The company was founded in 1991 and is based in New York, New York.
DHX Price Returns
| 1-mo | 26.89% |
| 3-mo | 96.10% |
| 6-mo | 43.81% |
| 1-year | 41.12% |
| 3-year | -42.15% |
| 5-year | 41.78% |
| YTD | 70.62% |
| 2024 | -31.66% |
| 2023 | -51.04% |
| 2022 | -15.22% |
| 2021 | 181.08% |
| 2020 | -26.25% |
Continue Researching DHX
Here are a few links from around the web to help you further your research on Dhi Group Inc's stock as an investment opportunity:Dhi Group Inc (DHX) Stock Price | Nasdaq
Dhi Group Inc (DHX) Stock Quote, History and News - Yahoo Finance
Dhi Group Inc (DHX) Stock Price and Basic Information | MarketWatch
Loading social stream, please wait...