DHI Group, Inc. (DHX): Price and Financial Metrics
DHX Price/Volume Stats
Current price | $2.52 | 52-week high | $4.22 |
Prev. close | $2.61 | 52-week low | $1.97 |
Day low | $2.52 | Volume | 377,100 |
Day high | $2.72 | Avg. volume | 188,468 |
50-day MA | $2.48 | Dividend yield | N/A |
200-day MA | $3.01 | Market Cap | 121.04M |
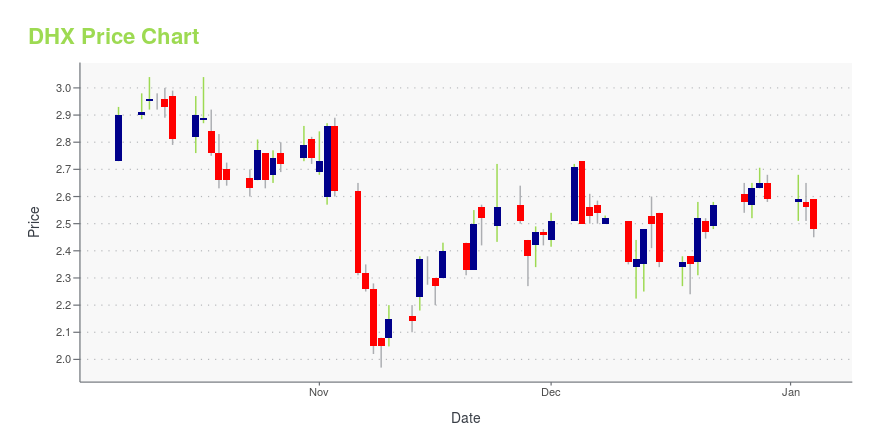
DHX Stock Price Chart Interactive Chart >
DHX POWR Grades
- DHX scores best on the Value dimension, with a Value rank ahead of 96.91% of US stocks.
- DHX's strongest trending metric is Momentum; it's been moving up over the last 26 weeks.
- DHX's current lowest rank is in the Growth metric (where it is better than 23.42% of US stocks).
DHX Stock Summary
- With a market capitalization of $119,853,750, DHI GROUP INC has a greater market value than just 21.4% of US stocks.
- With a year-over-year growth in debt of 27.6%, DHI GROUP INC's debt growth rate surpasses 81.01% of about US stocks.
- In terms of twelve month growth in earnings before interest and taxes, DHI GROUP INC is reporting a growth rate of 206.51%; that's higher than 94.24% of US stocks.
- If you're looking for stocks that are quantitatively similar to DHI GROUP INC, a group of peers worth examining would be MTRN, GNRC, VISL, GMED, and ASH.
- DHX's SEC filings can be seen here. And to visit DHI GROUP INC's official web site, go to www.dhigroupinc.com.
DHX Valuation Summary
- DHX's EV/EBIT ratio is 23.8; this is 12.26% higher than that of the median Technology stock.
- Over the past 199 months, DHX's EV/EBIT ratio has gone down 10.1.
Below are key valuation metrics over time for DHX.
Stock | Date | P/S | P/B | P/E | EV/EBIT |
---|---|---|---|---|---|
DHX | 2023-12-08 | 0.8 | 1.1 | 31.9 | 23.8 |
DHX | 2023-12-07 | 0.8 | 1.2 | 32.2 | 23.9 |
DHX | 2023-12-06 | 0.8 | 1.1 | 32.1 | 23.8 |
DHX | 2023-12-05 | 0.8 | 1.1 | 31.7 | 23.6 |
DHX | 2023-12-04 | 0.8 | 1.2 | 34.4 | 25.1 |
DHX | 2023-12-01 | 0.8 | 1.1 | 31.8 | 23.7 |
DHX Growth Metrics
- Its 5 year net income to common stockholders growth rate is now at 185.37%.
- Its 4 year revenue growth rate is now at -32.59%.
- Its 4 year net cashflow from operations growth rate is now at -51.57%.
The table below shows DHX's growth in key financial areas (numbers in millions of US dollars).
Date | Revenue | Operating Cash Flow | Net Income to Common Stock |
---|---|---|---|
2022-12-31 | 149.68 | 36.035 | 4.176 |
2022-09-30 | 143.666 | 31.644 | 2.057 |
2022-06-30 | 135.897 | 28.731 | 0.549 |
2022-03-31 | 127.561 | 31.375 | -31.112 |
2021-12-31 | 119.903 | 28.581 | -29.742 |
2021-09-30 | 125.323 | 29.862 | -27.979 |
DHX's Quality Factors
The “Quality” component of the POWR Ratings focuses on 31 different factors of a companies fundamentals and operational strength. Here are some key insights as we drill into the specifics of these quality attributes.- DHX has a Quality Grade of B, ranking ahead of 80.55% of graded US stocks.
- DHX's asset turnover comes in at 0.531 -- ranking 309th of 561 Business Services stocks.
- CRTO, WB, and AMN are the stocks whose asset turnover ratios are most correlated with DHX.
The table below shows DHX's key quality metrics over time.
Period | Asset Turnover | Gross Margin | ROIC |
---|---|---|---|
2021-06-30 | 0.531 | 0.870 | -1.350 |
2021-03-31 | 0.520 | 0.871 | -0.450 |
2020-12-31 | 0.515 | 0.875 | -0.618 |
2020-09-30 | 0.513 | 0.881 | -0.607 |
2020-06-30 | 0.525 | 0.884 | 0.136 |
2020-03-31 | 0.545 | 0.889 | 0.254 |
DHX Price Target
For more insight on analysts targets of DHX, see our DHX price target page. And for a list of of all stocks sorted by upside potential based on analyst target price, see our Top Price Target page.
Average Price Target | $6.50 | Average Broker Recommendation | 1.5 (Moderate Buy) |
DHI Group, Inc. (DHX) Company Bio
DHI Group is a provider of specialized websites and services for professional communities including technology and security clearance, financial services, energy, healthcare and hospitality. The company was founded in 1991 and is based in New York, New York.
Latest DHX News From Around the Web
Below are the latest news stories about DHI GROUP INC that investors may wish to consider to help them evaluate DHX as an investment opportunity.
Does The Market Have A Low Tolerance For DHI Group, Inc.'s (NYSE:DHX) Mixed Fundamentals?DHI Group (NYSE:DHX) has had a rough three months with its share price down 21%. It is possible that the markets have... |
DHI Group (NYSE:DHX) Has Some Difficulty Using Its Capital EffectivelyTo avoid investing in a business that's in decline, there's a few financial metrics that can provide early indications... |
DHI Group, Inc. (NYSE:DHX) Q3 2023 Earnings Call TranscriptDHI Group, Inc. (NYSE:DHX) Q3 2023 Earnings Call Transcript November 1, 2023 DHI Group, Inc. misses on earnings expectations. Reported EPS is $0.02279 EPS, expectations were $0.03. Operator: Good afternoon everyone, and welcome to DHI Group Incorporated Third Quarter 2023 Financial Results Conference Call. All participants will be in listen-only mode. [Operator Instructions] Also note, […] |
Q3 2023 DHI Group Inc Earnings CallQ3 2023 DHI Group Inc Earnings Call |
DHI Group Inc (DHX) Reports Q3 2023 Earnings: Net Income Turns Positive, Revenue DipsCompany sees a 16% YoY increase in Adjusted EBITDA, despite a 3% drop in total revenue |
DHX Price Returns
1-mo | -1.18% |
3-mo | 0.00% |
6-mo | -16.28% |
1-year | -29.41% |
3-year | -14.29% |
5-year | 0.00% |
YTD | -2.70% |
2023 | -51.04% |
2022 | -15.22% |
2021 | 181.08% |
2020 | -26.25% |
2019 | 98.03% |
Continue Researching DHX
Here are a few links from around the web to help you further your research on Dhi Group Inc's stock as an investment opportunity:Dhi Group Inc (DHX) Stock Price | Nasdaq
Dhi Group Inc (DHX) Stock Quote, History and News - Yahoo Finance
Dhi Group Inc (DHX) Stock Price and Basic Information | MarketWatch
Loading social stream, please wait...