
Desktop Metal Inc. (DM): Price and Financial Metrics
DM Price/Volume Stats
| Current price | $4.85 | 52-week high | $19.90 |
| Prev. close | $4.77 | 52-week low | $3.62 |
| Day low | $4.82 | Volume | 240,988 |
| Day high | $4.93 | Avg. volume | 497,710 |
| 50-day MA | $5.04 | Dividend yield | N/A |
| 200-day MA | $7.04 | Market Cap | 160.24M |
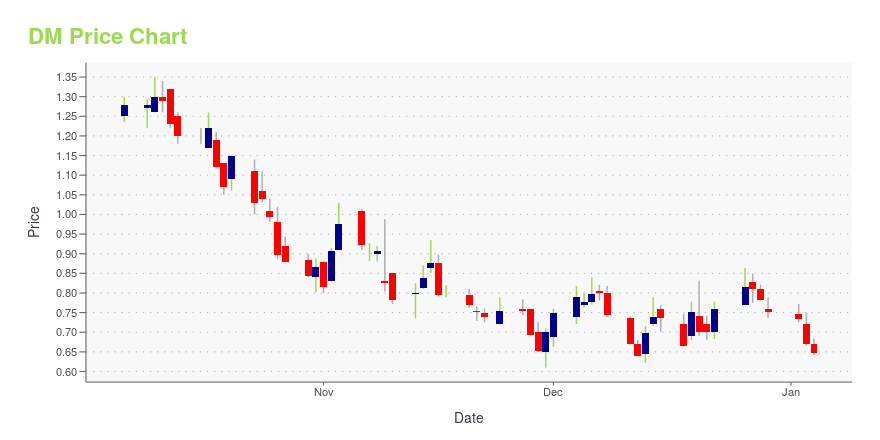
DM Stock Price Chart Interactive Chart >
Desktop Metal Inc. (DM) Company Bio
Desktop Metal, Inc. manufactures and sells additive manufacturing solutions for engineers, designers, and manufacturers in the Americas, Europe, the Middle East, Africa, and the Asia- Pacific. The company offers Production System, an industrial manufacturing solution; Shop System, a turnkey binder jetting platform for machine and job shops; Studio System, an office metal 3D printing system; and Fiber, a desktop 3D printer. It serves automotive, aerospace, healthcare, consumer products, heavy industry, machine design, and research and development industries. The company was founded in 2015 and is headquartered in Burlington, Massachusetts.
Latest DM News From Around the Web
Below are the latest news stories about DESKTOP METAL INC that investors may wish to consider to help them evaluate DM as an investment opportunity.
Carbon Introduces Three New Resins to Its Platform, Unlocking New Applications for Dental LabsCarbon, a leading product development and manufacturing technology company, announced the release of three breakthrough resins on its platform — Pac-Dent Rodin Sculpture, Desktop Health Flexcera Base, and Keystone KeyGuard. Each resin has been meticulously tested and validated for use with Carbon's printers, making a significant contribution to Carbon's dental materials portfolio. |
Desktop Metal Now Shipping the Figur G15 – a Digital Sheet Metal Forming Machine that Eliminates the Need for Custom ToolingBOSTON, December 06, 2023--The Figur G15 from Desktop Metal is the first commercially available machine tool platform to shape sheet metal on demand without custom tooling. |
Desktop Health Announces First Patients Treated with FDA-Cleared CMFlex™ – an Off-the-Shelf 3D Printed Synthetic Bone Graft Product Pioneered by Dimension Inx on the 3D-Bioplotter®BOSTON, November 29, 2023--Desktop Health – the trusted production-grade medical 3D printing brand of Desktop Metal, Inc. (NYSE: DM) – today announced the first patients have been treated with CMFlex™, an off-the-shelf 3D printed synthetic bone graft product developed and manufactured by Chicago-based Dimension Inx on the 3D-Bioplotter®. |
Desktop Metal, Inc. Receives Continued Listing Standard Notice from NYSEBOSTON, November 29, 2023--Desktop Metal, Inc. (NYSE: DM) ("Desktop Metal") today announced that it received notice from the New York Stock Exchange (the "NYSE") on November 22, 2023, indicating that Desktop Metal is not in compliance with NYSE’s continued listing standards because the average closing price of Desktop Metal’s common stock was less than $1.00 over a consecutive 30 trading-day period. The notice does not result in the immediate delisting of Desktop Metal’s common stock from the NY |
The 3 Best 3D Printing Stocks to Print Profits in 2024Explore the resurgence of 3D printing stocks, forecasted for a robust 23.3% CAGR, signaling expansive growth through 2030. |
DM Price Returns
| 1-mo | 18.87% |
| 3-mo | -40.97% |
| 6-mo | -23.55% |
| 1-year | -72.91% |
| 3-year | -94.68% |
| 5-year | N/A |
| YTD | -35.42% |
| 2023 | -44.78% |
| 2022 | -72.53% |
| 2021 | -71.22% |
| 2020 | 72.34% |
| 2019 | N/A |
Loading social stream, please wait...