
Destination XL Group, Inc. (DXLG): Price and Financial Metrics
DXLG Price/Volume Stats
| Current price | $3.56 | 52-week high | $5.28 |
| Prev. close | $3.57 | 52-week low | $3.01 |
| Day low | $3.52 | Volume | 111,125 |
| Day high | $3.68 | Avg. volume | 285,632 |
| 50-day MA | $3.56 | Dividend yield | N/A |
| 200-day MA | $3.83 | Market Cap | 207.32M |
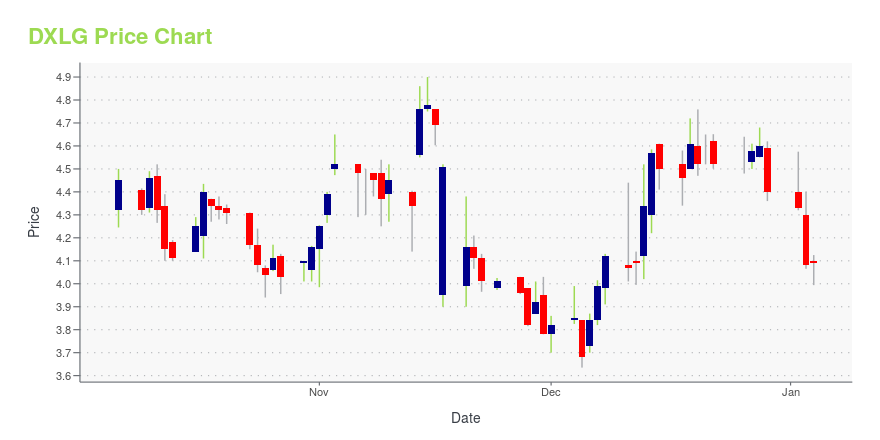
DXLG Stock Price Chart Interactive Chart >
Destination XL Group, Inc. (DXLG) Company Bio
Destination XL Group, Inc. operates as a specialty retailer of big and tall mens apparel in the United States and England. The company was founded in 1976 and is based in Canton, Massachusetts.
Latest DXLG News From Around the Web
Below are the latest news stories about DESTINATION XL GROUP INC that investors may wish to consider to help them evaluate DXLG as an investment opportunity.
7 Cheap Stocks to Buy Now if You Have $100 to Spend: November EditionUncover these top cheap stocks to buy for substantial portfolio expansion ahead of a likely bull run in 2024. |
Destination XL Group, Inc. Reports Third Quarter Financial ResultsSales of $119.2 million, Net Income of $0.06 per diluted share, Provides Updated GuidanceCANTON, Mass., Nov. 17, 2023 (GLOBE NEWSWIRE) -- Destination XL Group, Inc. (NASDAQ: DXLG), the leading integrated-commerce specialty retailer of Big + Tall men’s clothing and shoes, today reported operating results for the third quarter of fiscal 2023, and updated sales and earnings guidance for the fiscal year. Third Quarter Financial Highlights Total sales for the third quarter were $119.2 million, down 8 |
The 3 Best Penny Stocks to Buy in NovemberWhen it comes to extremely speculative, low-priced securities, you need to exercise extreme caution, even if they’re labeled as the best penny stocks to buy. |
Destination XL Group, Inc. to Announce Third Quarter 2023 Financial Results on November 17, 2023Company to Webcast Conference Call Live at 9:00 a.m. ETCANTON, Mass., Oct. 20, 2023 (GLOBE NEWSWIRE) -- Destination XL Group, Inc. (NASDAQ: DXLG), the leading integrated commerce retailer of Big + Tall men’s clothing and shoes, announced today it will release its third quarter of fiscal 2023 financial results before the market opens on Friday, November 17, 2023. President and Chief Executive Officer Harvey Kanter and Executive Vice President, Chief Financial Officer, and Treasurer Peter Stratton |
Destination XL Group (NASDAQ:DXLG) Could Become A Multi-BaggerFinding a business that has the potential to grow substantially is not easy, but it is possible if we look at a few key... |
DXLG Price Returns
| 1-mo | 0.28% |
| 3-mo | 5.64% |
| 6-mo | -16.63% |
| 1-year | -29.78% |
| 3-year | -25.83% |
| 5-year | 100.00% |
| YTD | -19.09% |
| 2023 | -34.81% |
| 2022 | 18.84% |
| 2021 | 2,018.61% |
| 2020 | -79.05% |
| 2019 | -41.01% |
Continue Researching DXLG
Here are a few links from around the web to help you further your research on Destination Xl Group Inc's stock as an investment opportunity:Destination Xl Group Inc (DXLG) Stock Price | Nasdaq
Destination Xl Group Inc (DXLG) Stock Quote, History and News - Yahoo Finance
Destination Xl Group Inc (DXLG) Stock Price and Basic Information | MarketWatch
Loading social stream, please wait...