Dycom Industries, Inc. (DY): Price and Financial Metrics
DY Price/Volume Stats
Current price | $87.13 | 52-week high | $122.13 |
Prev. close | $86.50 | 52-week low | $77.33 |
Day low | $83.99 | Volume | 62,869 |
Day high | $87.27 | Avg. volume | 415,803 |
50-day MA | $95.81 | Dividend yield | N/A |
200-day MA | $96.76 | Market Cap | 2.56B |
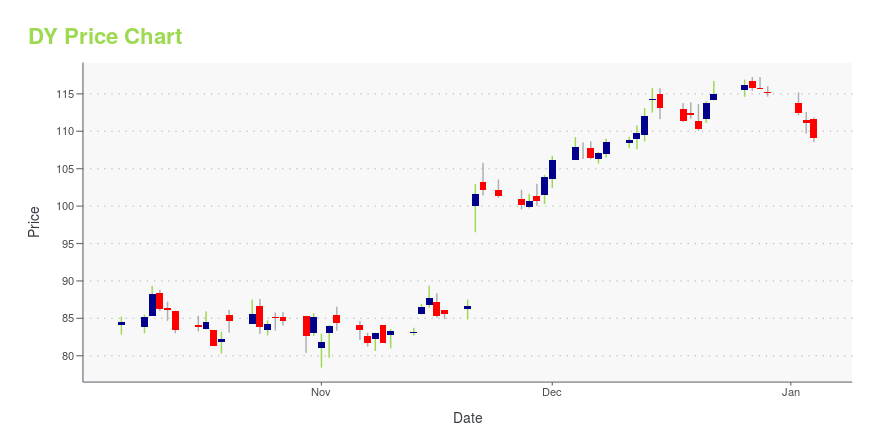
DY Stock Price Chart Interactive Chart >
DY POWR Grades
- DY scores best on the Momentum dimension, with a Momentum rank ahead of 81.14% of US stocks.
- The strongest trend for DY is in Stability, which has been heading up over the past 177 days.
- DY's current lowest rank is in the Stability metric (where it is better than 42.2% of US stocks).
DY Stock Summary
- The capital turnover (annual revenue relative to shareholder's equity) for DY is 4.2 -- better than 88.04% of US stocks.
- DYCOM INDUSTRIES INC's stock had its IPO on September 24, 1990, making it an older stock than 84.79% of US equities in our set.
- In terms of twelve month growth in earnings before interest and taxes, DYCOM INDUSTRIES INC is reporting a growth rate of 102.62%; that's higher than 88.28% of US stocks.
- If you're looking for stocks that are quantitatively similar to DYCOM INDUSTRIES INC, a group of peers worth examining would be SLVM, LTRY, OIS, VTOL, and HRT.
- Visit DY's SEC page to see the company's official filings. To visit the company's web site, go to www.dycomind.com.
DY Valuation Summary
- DY's price/sales ratio is 0.7; this is 63.16% lower than that of the median Industrials stock.
- Over the past 243 months, DY's EV/EBIT ratio has gone up 28.5.
Below are key valuation metrics over time for DY.
Stock | Date | P/S | P/B | P/E | EV/EBIT |
---|---|---|---|---|---|
DY | 2023-09-19 | 0.7 | 2.9 | 14.9 | 12.4 |
DY | 2023-09-18 | 0.7 | 2.9 | 14.8 | 12.3 |
DY | 2023-09-15 | 0.7 | 2.9 | 14.9 | 12.4 |
DY | 2023-09-14 | 0.7 | 3.0 | 15.0 | 12.5 |
DY | 2023-09-13 | 0.7 | 2.9 | 14.7 | 12.3 |
DY | 2023-09-12 | 0.7 | 3.0 | 15.0 | 12.4 |
DY Growth Metrics
- The 3 year net cashflow from operations growth rate now stands at 362.26%.
- The year over year cash and equivalents growth rate now stands at -43.87%.
- Its 4 year net income to common stockholders growth rate is now at -93.54%.

The table below shows DY's growth in key financial areas (numbers in millions of US dollars).
Date | Revenue | Operating Cash Flow | Net Income to Common Stock |
---|---|---|---|
2022-09-30 | 3,652.477 | 64.086 | 118.198 |
2022-06-30 | 3,464.027 | 172.9 | 92.903 |
2022-03-31 | 3,279.322 | 202.229 | 67.212 |
2021-12-31 | 3,130.519 | 308.655 | 48.574 |
2021-09-30 | 3,119.703 | 265.465 | 43.585 |
2021-06-30 | 3,075.986 | 273.101 | 48.794 |
DY's Quality Factors
The “Quality” component of the POWR Ratings focuses on 31 different factors of a companies fundamentals and operational strength. Here are some key insights as we drill into the specifics of these quality attributes.- DY has a Quality Grade of C, ranking ahead of 73.17% of graded US stocks.
- DY's asset turnover comes in at 1.445 -- ranking 17th of 51 Construction stocks.
- IBP, AGX, and ORN are the stocks whose asset turnover ratios are most correlated with DY.
The table below shows DY's key quality metrics over time.
Period | Asset Turnover | Gross Margin | ROIC |
---|---|---|---|
2021-07-31 | 1.445 | 0.163 | 0.045 |
2021-05-01 | 1.479 | 0.170 | 0.057 |
2021-01-30 | 1.427 | 0.174 | 0.042 |
2020-10-24 | 1.379 | 0.175 | 0.039 |
2020-07-25 | 1.362 | 0.173 | 0.033 |
2020-04-25 | 1.362 | 0.169 | 0.031 |
DY Price Target
For more insight on analysts targets of DY, see our DY price target page. And for a list of of all stocks sorted by upside potential based on analyst target price, see our Top Price Target page.
Average Price Target | $95.43 | Average Broker Recommendation | 1.36 (Strong Buy) |
Dycom Industries, Inc. (DY) Company Bio
Dycom Industries is a provider of specialty contracting services throughout the United States and in Canada. These services include engineering, construction, maintenance and installation services to telecommunications providers, underground facility locating services to various utilities, including telecommunications providers, and other construction and maintenance services to electric and gas utilities. The company was founded in 1969 and is based in Palm Beach Gardens, Florida.
Latest DY News From Around the Web
Below are the latest news stories about DYCOM INDUSTRIES INC that investors may wish to consider to help them evaluate DY as an investment opportunity.
How to Boost Your Portfolio with Top Construction Stocks Set to Beat EarningsInvestors looking for ways to find stocks that are set to beat quarterly earnings estimates should check out the Zacks Earnings ESP. |
Zacks Industry Outlook Highlights EMCOR Group, Dycom Industries and Primoris ServicesEMCOR Group, Dycom Industries and Primoris Services are part of the Zacks Industry Outlook article. |
3 Stocks to Watch From a Thriving Heavy Construction IndustryGrowth across the telecommunications, transmission, renewable energy and power generation businesses is set to benefit EME, DY and PRIM from the Zacks Building Products - Heavy Construction industry despite macroeconomic headwinds. |
Dycom Industries (DY) Down 7.1% Since Last Earnings Report: Can It Rebound?Dycom Industries (DY) reported earnings 30 days ago. What's next for the stock? We take a look at earnings estimates for some clues. |
Dycom Industries, Inc. to Present at the D.A. Davidson 22nd Annual Diversified Industrials & Services ConferencePALM BEACH GARDENS, Fla., Sept. 14, 2023 (GLOBE NEWSWIRE) -- Dycom Industries, Inc. (NYSE: DY) today announced that its senior management will present in a fireside chat format at the D.A. Davidson 22nd Annual Diversified Industrials & Services Conference in Nashville, TN on Thursday, September 21, 2023 at 9:30 a.m. CT / 10:30 a.m. ET. Management will also be available for one-on-one or group meetings with institutional investors. A live webcast of the fireside chat will be accessible from the E |
DY Price Returns
1-mo | N/A |
3-mo | -21.03% |
6-mo | N/A |
1-year | -16.05% |
3-year | 58.82% |
5-year | 8.84% |
YTD | -6.91% |
2022 | -0.17% |
2021 | 24.15% |
2020 | 60.17% |
2019 | -12.75% |
2018 | -51.50% |
Continue Researching DY
Want to see what other sources are saying about Dycom Industries Inc's financials and stock price? Try the links below:Dycom Industries Inc (DY) Stock Price | Nasdaq
Dycom Industries Inc (DY) Stock Quote, History and News - Yahoo Finance
Dycom Industries Inc (DY) Stock Price and Basic Information | MarketWatch
Loading social stream, please wait...