e.l.f. Beauty, Inc. (ELF): Price and Financial Metrics


e.l.f. Beauty, Inc. (ELF): $78.92

-1.50 (-1.87%)

POWR Rating

Component Grades

Growth

S

Value

I

Momentum

G

Stability

N

Sentiment

U

Quality

P

ELF POWR Grades

  • ELF scores best on the Growth dimension, with a Growth rank ahead of 99.67% of US stocks.
  • ELF's strongest trending metric is Stability; it's been moving down over the last 177 days.
  • ELF ranks lowest in Value; there it ranks in the 1st percentile.

ELF Stock Summary

  • ELF's current price/earnings ratio is 89.29, which is higher than 94.44% of US stocks with positive earnings.
  • The price/operating cash flow metric for ELF BEAUTY INC is higher than 92.21% of stocks in our set with a positive cash flow.
  • Of note is the ratio of ELF BEAUTY INC's sales and general administrative expense to its total operating expenses; 97.11% of US stocks have a lower such ratio.
  • Stocks with similar financial metrics, market capitalization, and price volatility to ELF BEAUTY INC are AAON, III, GLOB, ASIX, and BWMN.
  • Visit ELF's SEC page to see the company's official filings. To visit the company's web site, go to www.elfcosmetics.com.

ELF Valuation Summary

  • In comparison to the median Consumer Defensive stock, ELF's price/sales ratio is 320% higher, now standing at 8.4.
  • Over the past 79 months, ELF's price/earnings ratio has gone down 1028.

Below are key valuation metrics over time for ELF.

Stock Date P/S P/B P/E EV/EBIT
ELF 2023-03-24 8.4 10.9 89.3 70.3
ELF 2023-03-23 8.1 10.4 85.6 67.3
ELF 2023-03-22 7.8 10.1 83.2 65.4
ELF 2023-03-21 8.0 10.3 84.5 66.5
ELF 2023-03-20 8.0 10.3 84.8 66.7
ELF 2023-03-17 7.8 10.0 82.5 64.9

ELF Growth Metrics

    The 5 year cash and equivalents growth rate now stands at 201.84%.
  • Its 4 year revenue growth rate is now at 23.21%.
  • Its 2 year revenue growth rate is now at 38.64%.
ELF's revenue has moved up $173,923,000 over the prior 33 months.

The table below shows ELF's growth in key financial areas (numbers in millions of US dollars).

Date Revenue Operating Cash Flow Net Income to Common Stock
2022-09-30 448.203 61.785 33.949
2022-06-30 417.709 42.599 27.963
2022-03-31 392.155 19.513 21.77
2021-12-31 379.691 35.351 20.19
2021-09-30 370.135 26.836 18.273
2021-06-30 350.63 25.144 12.996

ELF's Quality Factors

The “Quality” component of the POWR Ratings focuses on 31 different factors of a companies fundamentals and operational strength. Here are some key insights as we drill into the specifics of these quality attributes.
  • ELF has a Quality Grade of C, ranking ahead of 47.63% of graded US stocks.
  • ELF's asset turnover comes in at 0.755 -- ranking 35th of 50 Consumer Goods stocks.
  • TPX, BTN, and KBAL are the stocks whose asset turnover ratios are most correlated with ELF.

The table below shows ELF's key quality metrics over time.

Period Asset Turnover Gross Margin ROIC
2021-09-30 0.755 0.637 0.086
2021-06-30 0.723 0.641 0.062
2021-03-31 0.668 0.648 0.032
2020-12-31 0.642 0.652 0.044
2020-09-30 0.634 0.654 0.075
2020-06-30 0.636 0.651 0.115

ELF Price Target

For more insight on analysts targets of ELF, see our ELF price target page. And for a list of of all stocks sorted by upside potential based on analyst target price, see our Top Price Target page.

Average Price Target $23.75 Average Broker Recommendation 1.46 (Moderate Buy)

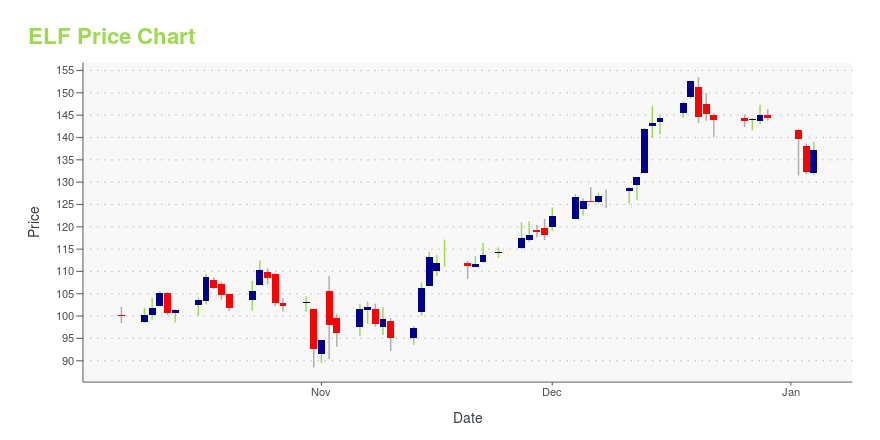
ELF Stock Price Chart Interactive Chart >

Price chart for ELF

ELF Price/Volume Stats

Current price $78.92 52-week high $81.63
Prev. close $80.42 52-week low $20.49
Day low $78.62 Volume 691,400
Day high $81.00 Avg. volume 965,479
50-day MA $70.12 Dividend yield N/A
200-day MA $49.11 Market Cap 4.21B

e.l.f. Beauty, Inc. (ELF) Company Bio


e.l.f. Beauty, Inc. develops, markets, and sells cosmetic products under the e.l.f. brand name. The company offers beauty products for eyes, lips, face, and skin care, as well as kits and beauty tools. Its eye makeup products comprise eyeshadows, eyeliners, mascara and eyelashes, and eyebrow grooming products; lip care products include lipsticks, glosses, and liners; and face makeup products consist of foundation products, primers, blushes, powders, concealers, bronzers, tinted moisturizers, shimmers, and luminizers. The company was formerly known as J.A. Cosmetics Holdings, Inc. and changed its name to e.l.f. Beauty, Inc. in April 2016. The company was founded in 2004 and is based in Oakland, California.


ELF Latest News Stream


Event/Time News Detail
Loading, please wait...

ELF Latest Social Stream


Loading social stream, please wait...

View Full ELF Social Stream

Latest ELF News From Around the Web

Below are the latest news stories about ELF BEAUTY INC that investors may wish to consider to help them evaluate ELF as an investment opportunity.

Here is Why Growth Investors Should Buy e.l.f. Beauty (ELF) Now

e.l.f. Beauty (ELF) could produce exceptional returns because of its solid growth attributes.

Yahoo | March 27, 2023

Is It Worth Investing in e.l.f. Beauty (ELF) Based on Wall Street's Bullish Views?

The average brokerage recommendation (ABR) for e.l.f. Beauty (ELF) is equivalent to a Buy. The overly optimistic recommendations of Wall Street analysts make the effectiveness of this highly sought-after metric questionable. So, is it worth buying the stock?

Yahoo | March 24, 2023

e.l.f. Beauty (NYSE:ELF) Might Have The Makings Of A Multi-Bagger

What trends should we look for it we want to identify stocks that can multiply in value over the long term? Ideally, a...

Yahoo | March 23, 2023

Are Consumer Staples Stocks Lagging e.l.f. Beauty (ELF) This Year?

Here is how e.l.f. Beauty (ELF) and Inter Parfums (IPAR) have performed compared to their sector so far this year.

Yahoo | March 22, 2023

Looking for a Growth Stock? 3 Reasons Why e.l.f. Beauty (ELF) is a Solid Choice

e.l.f. Beauty (ELF) could produce exceptional returns because of its solid growth attributes.

Yahoo | March 9, 2023

Read More 'ELF' Stories Here

ELF Price Returns

1-mo 6.38%
3-mo 42.71%
6-mo 109.78%
1-year 205.54%
3-year 702.03%
5-year 307.43%
YTD 42.71%
2022 66.52%
2021 31.84%
2020 56.17%
2019 86.26%
2018 -61.18%

Get Free Updates

Join thousands of investors who get the latest news, insights and top rated picks from StockNews.com!


Page generated in 0.7525 seconds.