Equity Lifestyle Properties, Inc. (ELS): Price and Financial Metrics
GET POWR RATINGS... FREE!
ELS POWR Grades
- ELS scores best on the Momentum dimension, with a Momentum rank ahead of 84.89% of US stocks.
- ELS's strongest trending metric is Growth; it's been moving up over the last 179 days.
- ELS ranks lowest in Value; there it ranks in the 12th percentile.
ELS Stock Summary
- ELS's one year PEG ratio, measuring expected growth in earnings next year relative to current common stock price is 458.18 -- higher than 93.98% of US-listed equities with positive expected earnings growth.
- For ELS, its debt to operating expenses ratio is greater than that reported by 93.5% of US equities we're observing.
- The volatility of Equity Lifestyle Properties Inc's share price is greater than that of only 9.31% US stocks with at least 200 days of trading history.
- If you're looking for stocks that are quantitatively similar to Equity Lifestyle Properties Inc, a group of peers worth examining would be KIM, BRX, REG, ADC, and EPRT.
- ELS's SEC filings can be seen here. And to visit Equity Lifestyle Properties Inc's official web site, go to www.equitylifestyleproperties.com.
ELS Valuation Summary
- In comparison to the median Real Estate stock, ELS's price/sales ratio is 717.65% higher, now standing at 13.9.
- ELS's EV/EBIT ratio has moved up 40.9 over the prior 243 months.
- Over the past 243 months, ELS's price/earnings ratio has gone up 47.3.
Below are key valuation metrics over time for ELS.
Stock | Date | P/S | P/B | P/E | EV/EBIT |
---|---|---|---|---|---|
ELS | 2021-09-02 | 13.9 | 13.1 | 67.3 | 55.6 |
ELS | 2021-09-01 | 13.6 | 12.9 | 66.0 | 54.7 |
ELS | 2021-08-31 | 13.4 | 12.6 | 64.7 | 53.8 |
ELS | 2021-08-30 | 13.2 | 12.4 | 63.9 | 53.2 |
ELS | 2021-08-27 | 13.0 | 12.2 | 62.9 | 52.5 |
ELS | 2021-08-26 | 12.9 | 12.2 | 62.4 | 52.2 |
ELS Growth Metrics
- Its year over year price growth rate is now at 9.01%.
- The 5 year price growth rate now stands at 79.5%.
- Its 2 year net cashflow from operations growth rate is now at 14.83%.

The table below shows ELS's growth in key financial areas (numbers in millions of US dollars).
Date | Revenue | Operating Cash Flow | Net Income to Common Stock |
---|---|---|---|
2021-12-31 | 1,271.694 | 595.052 | 262.462 |
2021-09-30 | 1,218.26 | 559.276 | 261.562 |
2021-06-30 | 1,170.349 | 556.718 | 241.497 |
2021-03-31 | 1,107.016 | 508.976 | 226.633 |
2020-12-31 | 1,091.448 | 466.537 | 228.268 |
2020-09-30 | 1,078.192 | 455.04 | 218.574 |
ELS's Quality Factors
The “Quality” component of the POWR Ratings focuses on 31 different factors of a companies fundamentals and operational strength. Here are some key insights as we drill into the specifics of these quality attributes.- ELS has a Quality Grade of D, ranking ahead of 22.42% of graded US stocks.
- ELS's asset turnover comes in at 0.256 -- ranking 76th of 444 Trading stocks.
- SSSS, LAZ, and WHG are the stocks whose asset turnover ratios are most correlated with ELS.
The table below shows ELS's key quality metrics over time.
Period | Asset Turnover | Gross Margin | ROIC |
---|---|---|---|
2021-09-30 | 0.256 | 0.510 | 0.048 |
2021-06-30 | 0.256 | 0.513 | 0.047 |
2021-03-31 | 0.250 | 0.517 | 0.047 |
2020-12-31 | 0.254 | 0.519 | 0.049 |
2020-09-30 | 0.255 | 0.519 | 0.049 |
2020-06-30 | 0.254 | 0.526 | 0.051 |
ELS Price Target
For more insight on analysts targets of ELS, see our ELS price target page. And for a list of of all stocks sorted by upside potential based on analyst target price, see our Top Price Target page.
Average Price Target | $87.18 | Average Broker Recommendation | 1.45 (Moderate Buy) |
ELS Stock Price Chart Interactive Chart >
ELS Price/Volume Stats
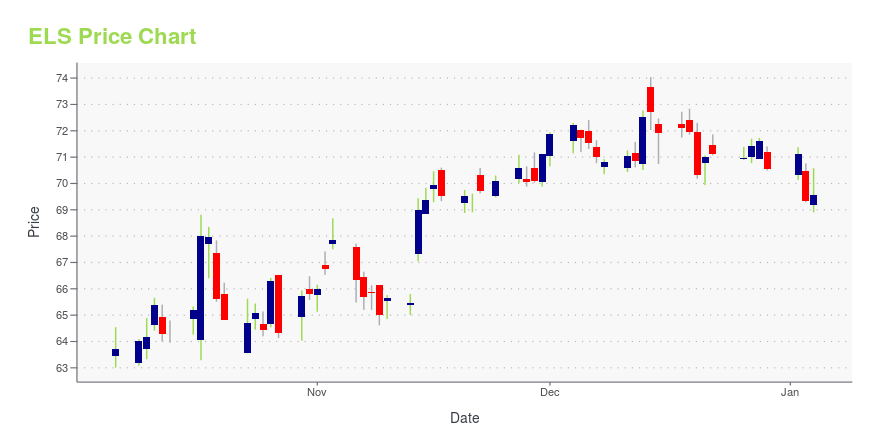
Current price | $71.86 | 52-week high | $88.70 |
Prev. close | $70.47 | 52-week low | $67.57 |
Day low | $70.28 | Volume | 844,400 |
Day high | $72.07 | Avg. volume | 947,399 |
50-day MA | $73.38 | Dividend yield | 2.28% |
200-day MA | $78.80 | Market Cap | 13.37B |
Equity Lifestyle Properties, Inc. (ELS) Company Bio
Equity LifeStyle Properties engages in the ownership and operation of lifestyle oriented properties and leases individual developed areas with access to utilities for placement of factory built homes, cottages, cabins or recreational vehicles. The company was founded in 1992 and is based in Chicago, Illinois.
Latest ELS News From Around the Web
Below are the latest news stories about Equity Lifestyle Properties Inc that investors may wish to consider to help them evaluate ELS as an investment opportunity.
Equity Lifestyle Properties, In Consensus Indicates Potential 21.3% UpsideEquity Lifestyle Properties, In found using ticker (ELS) now have 10 analysts in total covering the stock. The consensus rating is ''Buy''. The target price ranges between 97 and 85 and has a mean target at 91.8. Now with the previous closing price of 75.66 this would imply there is a potential upside of 21.3%. The day 50 moving average is 80.71 while the 200 day moving average is 80.36. The company has a market capitalisation of $13,859m. Company Website: https://www.equitylifestyleproperties.com [stock_market_widget type="chart" template="basic" color="green" assets=ELS" range="6mo" interval="1d" axes="true" cursor="true" api="yf"] The potential market cap would be $16,815m based on the market concensus. We are a self-administered, self-managed real estate investment trust (ÂREITÂ) ... |
Sun Communities: A Fantastic REIT That Is Still A Little Too Rich For My BloodNote: This article was written in coordination with Colorado Wealth Management Fund. I believe Sun Communities (SUI) to be one of the absolute best housing REITs. Their vast portfolio generates strong growth and deserves a premium, as such. However, the current valuations across the housing REIT sector tend to be... |
Equity LifeStyle Properties: Finally, A Fairer PriceEquity LifeStyle Properties has exceptional quality at a fair price. If the price falls further, I''ll buy more. Learn more about ELS stock here. |
American Assets Capital Advisers, LLC Buys WeWork Inc, Camden Property Trust, GDS Holdings, ...Investment company American Assets Capital Advisers, LLC (Current Portfolio) buys WeWork Inc, Camden Property Trust, GDS Holdings, AvalonBay Communities Inc, American Homes 4 Rent, sells Innovative Industrial Properties Inc, Brookfield Renewable Corp, Wynn Resorts, MGM Resorts International, CoStar Group Inc during the 3-months ended 2021Q4, according to the most recent filings of the investment company, American Assets Capital Advisers, LLC. |
Demars Financial Group, LLC Buys iShares TIPS Bond ETF, Medical Properties Trust Inc, Phillips ...Investment company Demars Financial Group, LLC (Current Portfolio) buys iShares TIPS Bond ETF, Medical Properties Trust Inc, Phillips 66, Equity Lifestyle Properties Inc, AbbVie Inc, sells Vanguard Intermediate-Term Government Bond ETF, Digital Realty Trust Inc, Sprott Physical Gold and Silver Trust, Fidelity MSCI Utilities Index ETF, Cerner Corp during the 3-months ended 2021Q4, according to the most recent filings of the investment company, Demars Financial Group, LLC. |
ELS Price Returns
1-mo | -4.80% |
3-mo | -8.59% |
6-mo | -14.50% |
1-year | -2.47% |
3-year | 22.28% |
5-year | 85.91% |
YTD | -17.08% |
2021 | 41.02% |
2020 | -7.82% |
2019 | 47.46% |
2018 | 11.76% |
2017 | 26.38% |
ELS Dividends
Ex-Dividend Date | Type | Payout Amount | Change | ||||||
---|---|---|---|---|---|---|---|---|---|
Loading, please wait... |
Continue Researching ELS
Here are a few links from around the web to help you further your research on Equity Lifestyle Properties Inc's stock as an investment opportunity:Equity Lifestyle Properties Inc (ELS) Stock Price | Nasdaq
Equity Lifestyle Properties Inc (ELS) Stock Quote, History and News - Yahoo Finance
Equity Lifestyle Properties Inc (ELS) Stock Price and Basic Information | MarketWatch
Loading social stream, please wait...