Equity Commonwealth Common Shares of Beneficial Interest (EQC): Price and Financial Metrics
GET POWR RATINGS... FREE!
EQC POWR Grades
- Growth is the dimension where EQC ranks best; there it ranks ahead of 86.79% of US stocks.
- EQC's strongest trending metric is Quality; it's been moving up over the last 177 days.
- EQC's current lowest rank is in the Value metric (where it is better than 17.83% of US stocks).
EQC Stock Summary
- With a price/earnings ratio of 410.15, EQUITY COMMONWEALTH P/E ratio is greater than that of about 98.77% of stocks in our set with positive earnings.
- The ratio of debt to operating expenses for EQUITY COMMONWEALTH is higher than it is for about just 0.48% of US stocks.
- In terms of volatility of its share price, EQC is more volatile than only 1.59% of stocks we're observing.
- Stocks with similar financial metrics, market capitalization, and price volatility to EQUITY COMMONWEALTH are CDRE, FWRG, BMBL, PAYS, and PNTG.
- Visit EQC's SEC page to see the company's official filings. To visit the company's web site, go to www.eqcre.com.
EQC Valuation Summary
- EQC's price/sales ratio is 45.1; this is 802% higher than that of the median Real Estate stock.
- Over the past 243 months, EQC's EV/EBIT ratio has gone down 5.5.
Below are key valuation metrics over time for EQC.
Stock | Date | P/S | P/B | P/E | EV/EBIT |
---|---|---|---|---|---|
EQC | 2023-02-03 | 45.1 | 1 | 411.6 | 6.2 |
EQC | 2023-02-02 | 45.5 | 1 | 415.5 | 8.0 |
EQC | 2023-02-01 | 45.0 | 1 | 411.0 | 5.9 |
EQC | 2023-01-31 | 45.2 | 1 | 412.7 | 6.7 |
EQC | 2023-01-30 | 44.8 | 1 | 409.2 | 5.1 |
EQC | 2023-01-27 | 45.0 | 1 | 411.1 | 6.0 |
EQC Growth Metrics
- Its 4 year net cashflow from operations growth rate is now at -28.68%.
- Its 2 year net cashflow from operations growth rate is now at -82.16%.
- Its 2 year revenue growth rate is now at -42.97%.

The table below shows EQC's growth in key financial areas (numbers in millions of US dollars).
Date | Revenue | Operating Cash Flow | Net Income to Common Stock |
---|---|---|---|
2022-09-30 | 61.748 | 37.963 | 6.766 |
2022-06-30 | 60.503 | 26.944 | -8.232 |
2022-03-31 | 59.837 | 17.477 | -13.064 |
2021-12-31 | 58.002 | 16.109 | -24.384 |
2021-09-30 | 58.315 | 12.147 | -24.416 |
2021-06-30 | 60.919 | 13.19 | -21.239 |
EQC's Quality Factors
The “Quality” component of the POWR Ratings focuses on 31 different factors of a companies fundamentals and operational strength. Here are some key insights as we drill into the specifics of these quality attributes.- EQC has a Quality Grade of D, ranking ahead of 10.81% of graded US stocks.
- EQC's asset turnover comes in at 0.018 -- ranking 334th of 444 Trading stocks.
- SIEB, IRM, and BLK are the stocks whose asset turnover ratios are most correlated with EQC.
The table below shows EQC's key quality metrics over time.
Period | Asset Turnover | Gross Margin | ROIC |
---|---|---|---|
2021-09-30 | 0.018 | 0.549 | -0.056 |
2021-06-30 | 0.018 | 0.563 | -0.045 |
2021-03-31 | 0.018 | 0.571 | 0.058 |
2020-12-31 | 0.018 | 0.565 | 1.418 |
2020-09-30 | 0.021 | 0.592 | 1.230 |
2020-06-30 | 0.024 | 0.600 | 1.105 |
EQC Price Target
For more insight on analysts targets of EQC, see our EQC price target page. And for a list of of all stocks sorted by upside potential based on analyst target price, see our Top Price Target page.
Average Price Target | $28.75 | Average Broker Recommendation | 2.25 (Moderate Sell) |
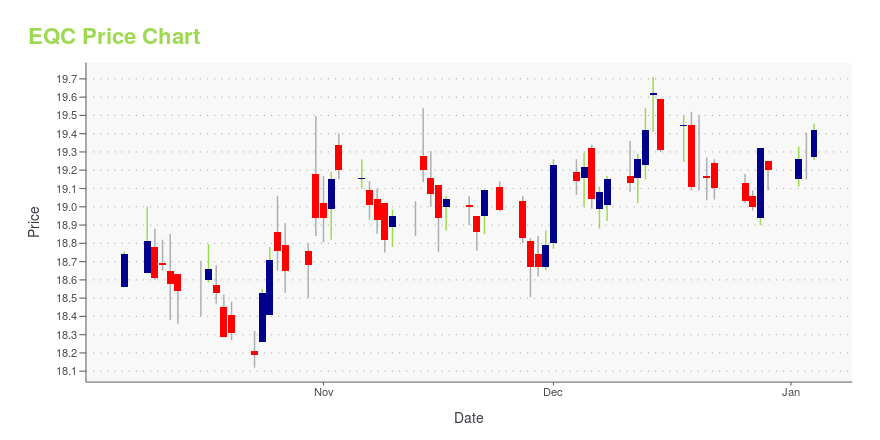
EQC Stock Price Chart Interactive Chart >
EQC Price/Volume Stats
Current price | $25.36 | 52-week high | $28.84 |
Prev. close | $25.45 | 52-week low | $23.88 |
Day low | $25.11 | Volume | 625,600 |
Day high | $25.37 | Avg. volume | 975,100 |
50-day MA | $25.63 | Dividend yield | N/A |
200-day MA | $26.30 | Market Cap | 2.78B |
Equity Commonwealth Common Shares of Beneficial Interest (EQC) Company Bio
Equity Commonwealth owns and operates office buildings in central business district and suburban locations throughout the United States. The company was established in 2014 and is based in Chicago, Illinois.
Latest EQC News From Around the Web
Below are the latest news stories about EQUITY COMMONWEALTH that investors may wish to consider to help them evaluate EQC as an investment opportunity.
Equity – Consensus Indicates Potential .8% UpsideEquity found using ticker (EQC) now have 2 analysts covering the stock with the consensus suggesting a rating of ''Hold''. The target price ranges between 27 and 24 with a mean TP of 25.5. With the stocks previous close at 25.3 this indicates there is a potential upside of .8%. The 50 day moving average now sits at 25.7 and the 200 moving average now moves to 26.34. The market cap for the company is $2,793m. Find out more information at: https://www.eqcre.com [stock_market_widget type="chart" template="basic" color="green" assets="EQC" range="6mo" interval="1d" axes="true" cursor="true" api="yf"] The potential market cap would be $2,815m based on the market concensus. Equity Commonwealth (NYSE: EQC) is a Chicago based, internally managed and self-advised real estate investment trust (RE... |
Equity Commonwealth Announces Tax Treatment of 2022 DistributionsCHICAGO--(BUSINESS WIRE)--Equity Commonwealth (NYSE: EQC) today announced the tax treatment of its 2022 common and preferred share distributions, which is as follows: Common Stock (CUSIP No. 294628102) Record Date Payment Date Total Distribution per Share 2022 Taxable Ordinary Dividends 2022 Non-taxable Distribution (Return of Capital) 2022 Section 199A Dividends1 9/29/2022 10/18/2022 $1.00 $ 0.99 $0.01 $ 0.99 Series D Cumulative Convertible Preferred Stock (CUSIP No. 294628201) Record Date Pay |
Equity – Consensus Indicates Potential -.3% DownsideEquity with ticker code (EQC) have now 2 analysts covering the stock with the consensus suggesting a rating of ''Hold''. The range between the high target price and low target price is between 27 and 24 calculating the mean target price we have 25.5. With the stocks previous close at 25.58 this now indicates there is a potential downside of -.3%. The 50 day MA is 25.8 and the 200 day moving average is 26.44. The company has a market cap of $2,792m. Company Website: https://www.eqcre.com [stock_market_widget type="chart" template="basic" color="green" assets="EQC" range="6mo" interval="1d" axes="true" cursor="true" api="yf"] The potential market cap would be $2,783m based on the market concensus. Equity Commonwealth (NYSE: EQC) is a Chicago based, internally managed and self-advised real... |
Can you now get a good deal on Equity Commonwealth’s shares?A share of Equity Commonwealth (NYSE:EQC) closed at $25.58 per share on Friday, down from $25.99 day before. While Equity Commonwealth has underperformed by -1.58%, investors are advised to look at stock chart patterns for technical insight. Within its last year performance, EQC rose by 1.89%, with highs and lows ranging from $27.69 to $23.88, […] |
Equity Commonwealth Declares Series D Preferred DividendCHICAGO, January 13, 2023--Equity Commonwealth (NYSE: EQC) announced today that its Board of Trustees declared a dividend on the company’s Series D Preferred Shares. A quarterly dividend of $0.40625 per Series D Preferred Share will be paid on February 15, 2023 to shareholders of record on January 31, 2023 for the period from November 15, 2022 through February 14, 2023. |
EQC Price Returns
1-mo | -0.47% |
3-mo | -2.08% |
6-mo | -5.76% |
1-year | -2.57% |
3-year | -22.61% |
5-year | -9.75% |
YTD | 1.56% |
2022 | -3.59% |
2021 | -5.06% |
2020 | -16.91% |
2019 | 9.40% |
2018 | -1.64% |
Continue Researching EQC
Want to see what other sources are saying about Equity Commonwealth's financials and stock price? Try the links below:Equity Commonwealth (EQC) Stock Price | Nasdaq
Equity Commonwealth (EQC) Stock Quote, History and News - Yahoo Finance
Equity Commonwealth (EQC) Stock Price and Basic Information | MarketWatch
Loading social stream, please wait...