Energy Recovery, Inc. (ERII): Price and Financial Metrics
ERII Price/Volume Stats
Current price | $18.88 | 52-week high | $30.76 |
Prev. close | $19.06 | 52-week low | $14.04 |
Day low | $18.75 | Volume | 532,885 |
Day high | $19.21 | Avg. volume | 413,558 |
50-day MA | $18.86 | Dividend yield | N/A |
200-day MA | $23.66 | Market Cap | 1.07B |
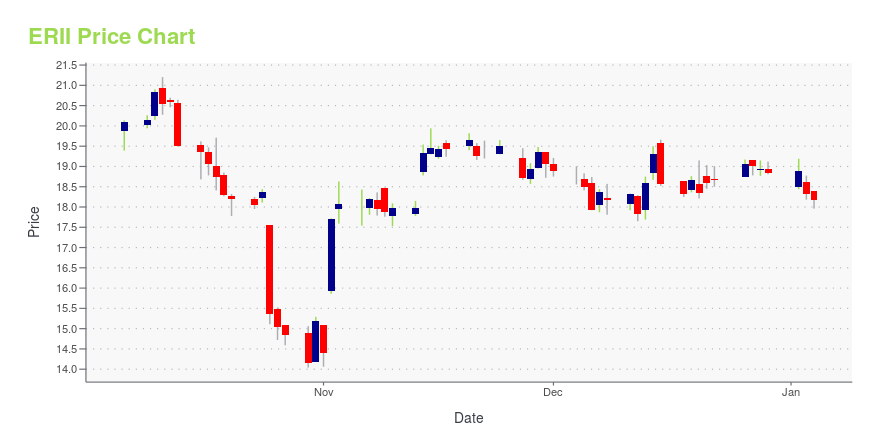
ERII Stock Price Chart Interactive Chart >
ERII POWR Grades
- Quality is the dimension where ERII ranks best; there it ranks ahead of 96.63% of US stocks.
- ERII's strongest trending metric is Quality; it's been moving down over the last 177 days.
- ERII's current lowest rank is in the Value metric (where it is better than 2.88% of US stocks).
ERII Stock Summary
- ERII's current price/earnings ratio is 65.85, which is higher than 91.45% of US stocks with positive earnings.
- Price to trailing twelve month operating cash flow for ERII is currently 54.5, higher than 94.89% of US stocks with positive operating cash flow.
- For ERII, its debt to operating expenses ratio is greater than that reported by merely 0.22% of US equities we're observing.
- Stocks that are quantitatively similar to ERII, based on their financial statements, market capitalization, and price volatility, are TDC, OSIS, IGT, AMSWA, and STEM.
- ERII's SEC filings can be seen here. And to visit ENERGY RECOVERY INC's official web site, go to www.energyrecovery.com.
ERII Valuation Summary
- ERII's EV/EBIT ratio is 59.3; this is 282.58% higher than that of the median Industrials stock.
- ERII's price/earnings ratio has moved down 18.3 over the prior 187 months.
Below are key valuation metrics over time for ERII.
Stock | Date | P/S | P/B | P/E | EV/EBIT |
---|---|---|---|---|---|
ERII | 2023-11-09 | 8.9 | 5.2 | 65.5 | 59.3 |
ERII | 2023-11-08 | 8.9 | 5.2 | 65.8 | 59.6 |
ERII | 2023-11-07 | 9.1 | 5.3 | 66.7 | 60.5 |
ERII | 2023-11-06 | 9.0 | 5.3 | 66.4 | 60.1 |
ERII | 2023-11-03 | 9.0 | 5.3 | 66.2 | 60.0 |
ERII | 2023-11-02 | 8.8 | 5.2 | 64.9 | 58.7 |
ERII Growth Metrics
- The year over year revenue growth rate now stands at -14.93%.
- The 5 year net income to common stockholders growth rate now stands at 245.93%.
- The 4 year net cashflow from operations growth rate now stands at 1233.42%.

The table below shows ERII's growth in key financial areas (numbers in millions of US dollars).
Date | Revenue | Operating Cash Flow | Net Income to Common Stock |
---|---|---|---|
2022-09-30 | 116.876 | 12.5 | 15.587 |
2022-06-30 | 107.195 | 9.464 | 11.869 |
2022-03-31 | 107.51 | 11.87 | 15.297 |
2021-12-31 | 103.904 | 13.526 | 14.269 |
2021-09-30 | 96.754 | 13.814 | 12.459 |
2021-06-30 | 103.381 | 28.705 | 16.775 |
ERII's Quality Factors
The “Quality” component of the POWR Ratings focuses on 31 different factors of a companies fundamentals and operational strength. Here are some key insights as we drill into the specifics of these quality attributes.- ERII has a Quality Grade of B, ranking ahead of 91.85% of graded US stocks.
- ERII's asset turnover comes in at 0.502 -- ranking 84th of 104 Machinery stocks.
- MIDD, SOI, and TRT are the stocks whose asset turnover ratios are most correlated with ERII.
The table below shows ERII's key quality metrics over time.
Period | Asset Turnover | Gross Margin | ROIC |
---|---|---|---|
2021-06-30 | 0.502 | 0.689 | 0.197 |
2021-03-31 | 0.632 | 0.750 | 0.426 |
2020-12-31 | 0.614 | 0.763 | 0.331 |
2020-09-30 | 0.590 | 0.781 | 0.259 |
2020-06-30 | 0.579 | 0.798 | 0.232 |
2020-03-31 | 0.471 | 0.762 | 0.079 |
ERII Price Target
For more insight on analysts targets of ERII, see our ERII price target page. And for a list of of all stocks sorted by upside potential based on analyst target price, see our Top Price Target page.
Average Price Target | $24.50 | Average Broker Recommendation | 1.5 (Moderate Buy) |
Energy Recovery, Inc. (ERII) Company Bio
Energy Recovery, Inc. designs, develops, and manufactures energy recovery devices (ERDs) to transform untapped energy into reusable energy from industrial fluid flows and pressure cycles. The company was founded in 1992 and is based in San Leandro, California.
Latest ERII News From Around the Web
Below are the latest news stories about ENERGY RECOVERY INC that investors may wish to consider to help them evaluate ERII as an investment opportunity.
Are Energy Recovery, Inc.'s (NASDAQ:ERII) Mixed Financials Driving The Negative Sentiment?It is hard to get excited after looking at Energy Recovery's (NASDAQ:ERII) recent performance, when its stock has... |
Estimating The Intrinsic Value Of Energy Recovery, Inc. (NASDAQ:ERII)Key Insights Using the 2 Stage Free Cash Flow to Equity, Energy Recovery fair value estimate is US$18.14 Energy... |
Energy Recovery, Inc. (NASDAQ:ERII) Q3 2023 Earnings Call TranscriptEnergy Recovery, Inc. (NASDAQ:ERII) Q3 2023 Earnings Call Transcript November 1, 2023 Operator: Greetings. Welcome to the Energy Recovery 3Q 2023 Earnings Call. At this time, all participants are in a listen-only mode. A question-and-answer session will follow the formal presentation. [Operator Instructions] Please note this conference is being recorded. I will now turn the […] |
Energy Recovery Inc (ERII) Reports 22% YoY Quarterly Revenue Growth in Q3 2023Company's net income doubles, beating estimates |
Energy Recovery Achieves 22% Year-on-Year Quarterly Revenue Growth, Beating GuidanceSAN LEANDRO, Calif., November 01, 2023--Energy Recovery, Inc. (Nasdaq:ERII) ("Energy Recovery" or the "Company") today announced its financial results for the third quarter and nine months ended September 30, 2023. |
ERII Price Returns
1-mo | 31.02% |
3-mo | -25.61% |
6-mo | -25.35% |
1-year | -17.12% |
3-year | 70.55% |
5-year | 131.09% |
YTD | -7.86% |
2022 | -4.65% |
2021 | 57.55% |
2020 | 39.33% |
2019 | 45.47% |
2018 | -23.09% |
Continue Researching ERII
Want to do more research on Energy Recovery Inc's stock and its price? Try the links below:Energy Recovery Inc (ERII) Stock Price | Nasdaq
Energy Recovery Inc (ERII) Stock Quote, History and News - Yahoo Finance
Energy Recovery Inc (ERII) Stock Price and Basic Information | MarketWatch
Loading social stream, please wait...