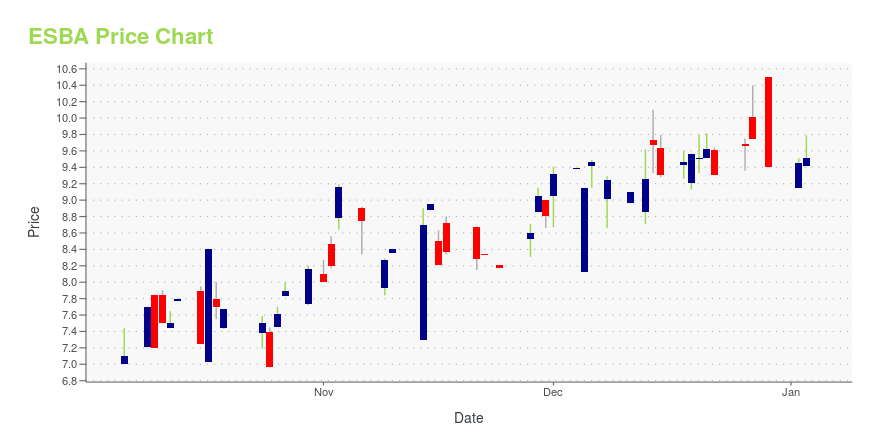
Empire State Realty OP, L.P. Series ES Operating Partnership Limited Partnership Interests (ESBA): Price and Financial Metrics

Empire State Realty OP, L.P. Series ES Operating Partnership Limited Partnership Interests (ESBA): $9.47

0.32 (+3.50%)

POWR Rating

Component Grades

Momentum

C

Stability

C

Sentiment

Quality

C

Add ESBA to Watchlist
Sign Up

Industry: REITs - Diversified

Industry

D

Ranked

#5 of 46

in industry

ESBA Price/Volume Stats

Current price $9.47 52-week high $9.49
Prev. close $9.15 52-week low $5.08
Day low $9.15 Volume 7,900
Day high $9.49 Avg. volume 6,696
50-day MA $8.17 Dividend yield N/A
200-day MA $7.31 Market Cap N/A

ESBA Stock Price Chart Interactive Chart >

ESBA POWR Grades

  • Growth is the dimension where ESBA ranks best; there it ranks ahead of 88.82% of US stocks.
  • ESBA's strongest trending metric is Momentum; it's been moving up over the last 90 days.
  • ESBA ranks lowest in Quality; there it ranks in the 37th percentile.

ESBA Stock Summary

  • ESBA's current price/earnings ratio is 3.03, which is higher than merely 3.5% of US stocks with positive earnings.
  • Price to trailing twelve month operating cash flow for ESBA is currently 0.99, higher than just 3.74% of US stocks with positive operating cash flow.
  • Shareholder yield, a measure of how much is returned to shareholders via dividends and share repurchases, for ESBA comes in at 36.67% -- higher than that of 94.46% of stocks in our set.
  • If you're looking for stocks that are quantitatively similar to EMPIRE STATE REALTY OP LP, a group of peers worth examining would be BRX, CTRE, REI, EPRT, and UDR.
  • Visit ESBA's SEC page to see the company's official filings. To visit the company's web site, go to www.empirestaterealtytrust.com.

ESBA Valuation Summary

  • In comparison to the median Real Estate stock, ESBA's price/sales ratio is 92.31% lower, now standing at 0.3.
  • ESBA's price/sales ratio has moved NA NA over the prior 123 months.

Below are key valuation metrics over time for ESBA.

Stock Date P/S P/B P/E EV/EBIT
ESBA 2023-10-30 0.3 0.1 3.0 11.3
ESBA 2023-10-27 0.3 0.1 2.9 11.2
ESBA 2023-10-26 0.3 0.1 2.8 11.2
ESBA 2023-10-25 0.3 0.1 2.6 11.1
ESBA 2023-10-24 0.3 0.1 2.8 11.2
ESBA 2023-10-23 0.3 0.1 2.7 11.1

ESBA Growth Metrics

    Its 4 year revenue growth rate is now at 7.06%.
  • The 2 year cash and equivalents growth rate now stands at -53.85%.
  • Its 4 year price growth rate is now at -62.65%.
Over the past 33 months, ESBA's revenue has gone down $25,241,000.

The table below shows ESBA's growth in key financial areas (numbers in millions of US dollars).

Date Revenue Operating Cash Flow Net Income to Common Stock
2022-09-30 706.102 219.444 33.605
2022-06-30 687.438 212.435 13.255
2022-03-31 642.824 206.779 -31.188
2021-12-31 624.094 212.486 -17.221
2021-09-30 615.159 185.767 -12.454
2021-06-30 596.686 191.599 -14.54

ESBA's Quality Factors

The “Quality” component of the POWR Ratings focuses on 31 different factors of a companies fundamentals and operational strength. Here are some key insights as we drill into the specifics of these quality attributes.
  • ESBA has a Quality Grade of C, ranking ahead of 26.51% of graded US stocks.
  • ESBA's asset turnover comes in at 0.145 -- ranking 126th of 444 Trading stocks.
  • ESRT, CBLAQ, and DRH are the stocks whose asset turnover ratios are most correlated with ESBA.

The table below shows ESBA's key quality metrics over time.

Period Asset Turnover Gross Margin ROIC
2021-06-30 0.145 0.530 0.015
2021-03-31 0.139 0.523 0.010
2020-12-31 0.140 0.522 0.011
2020-09-30 0.152 0.533 0.017
2020-06-30 0.164 0.541 0.024
2020-03-31 0.176 0.545 0.032

Empire State Realty OP, L.P. Series ES Operating Partnership Limited Partnership Interests (ESBA) Company Bio


Empire State Realty OP, L.P. operates as a subsidiary of Empire State Realty Trust, Inc.


ESBA Latest News Stream


Event/Time News Detail
Loading, please wait...

ESBA Latest Social Stream


Loading social stream, please wait...

View Full ESBA Social Stream

Latest ESBA News From Around the Web

Below are the latest news stories about EMPIRE STATE REALTY OP LP that investors may wish to consider to help them evaluate ESBA as an investment opportunity.

Empire State Realty Trust Inc (ESRT) Raises 2023 Guidance Following Q3 Results

ESRT reports Q3 net income per fully diluted share of $0.07 and core FFO per fully diluted share of $0.25

Yahoo | October 25, 2023

Unveiling Empire State Realty OP LP (ESBA)'s Value: Is It Really Priced Right? A Comprehensive Guide

A deep dive into the valuation of Empire State Realty OP LP (ESBA), providing a detailed analysis of its intrinsic value and market performance.

Yahoo | October 3, 2023

Empire State Realty OP LP (ESBA)'s True Worth: A Comprehensive Analysis of Its Market Value

Unveiling the intrinsic value of Empire State Realty OP LP

Yahoo | September 25, 2023

Empire State Realty OP LP (ESBA): A Hidden Gem in the REITs Industry?

A Comprehensive Examination of Its Intrinsic Value

Yahoo | September 19, 2023

Empire State Realty OP LP (ESBA): An Underappreciated Gem in the Market?

Unraveling the Intrinsic Value of Empire State Realty OP LP

Yahoo | September 11, 2023

Read More 'ESBA' Stories Here

ESBA Price Returns

1-mo 8.85%
3-mo 14.03%
6-mo N/A
1-year N/A
3-year -1.21%
5-year -34.89%
YTD 47.06%
2022 -25.01%
2021 -1.99%
2020 -32.61%
2019 1.12%
2018 -31.06%

Get Free Updates

Join thousands of investors who get the latest news, insights and top rated picks from StockNews.com!