FTI Consulting, Inc. (FCN): Price and Financial Metrics
GET POWR RATINGS... FREE!
FCN POWR Grades
- Stability is the dimension where FCN ranks best; there it ranks ahead of 88.12% of US stocks.
- FCN's strongest trending metric is Stability; it's been moving up over the last 179 days.
- FCN's current lowest rank is in the Growth metric (where it is better than 14.95% of US stocks).
FCN Stock Summary
- With a one year PEG ratio of 179.62, Fti Consulting Inc is expected to have a higher PEG ratio (a measure of how expensive a stock is relative to its expected earnings growth) than 86.22% of US stocks.
- Of note is the ratio of Fti Consulting Inc's sales and general administrative expense to its total operating expenses; 81.62% of US stocks have a lower such ratio.
- The volatility of Fti Consulting Inc's share price is greater than that of only 5.69% US stocks with at least 200 days of trading history.
- Stocks with similar financial metrics, market capitalization, and price volatility to Fti Consulting Inc are THG, WTS, LECO, ABM, and AIR.
- FCN's SEC filings can be seen here. And to visit Fti Consulting Inc's official web site, go to www.fticonsulting.com.
FCN Valuation Summary
- FCN's price/earnings ratio is 20.4; this is 23.45% lower than that of the median Industrials stock.
- Over the past 243 months, FCN's price/earnings ratio has gone down 21.7.
- FCN's price/earnings ratio has moved down 21.7 over the prior 243 months.
Below are key valuation metrics over time for FCN.
Stock | Date | P/S | P/B | P/E | EV/EBIT |
---|---|---|---|---|---|
FCN | 2021-09-03 | 1.8 | 3.2 | 20.4 | 16.6 |
FCN | 2021-09-02 | 1.8 | 3.2 | 20.4 | 16.6 |
FCN | 2021-09-01 | 1.8 | 3.2 | 20.7 | 16.8 |
FCN | 2021-08-31 | 1.8 | 3.2 | 20.6 | 16.7 |
FCN | 2021-08-30 | 1.8 | 3.2 | 20.7 | 16.8 |
FCN | 2021-08-27 | 1.8 | 3.2 | 20.5 | 16.7 |
FCN Growth Metrics
- The year over year net income to common stockholders growth rate now stands at 3.61%.
- The 2 year cash and equivalents growth rate now stands at 46.71%.
- Its year over year revenue growth rate is now at 5.69%.

The table below shows FCN's growth in key financial areas (numbers in millions of US dollars).
Date | Revenue | Operating Cash Flow | Net Income to Common Stock |
---|---|---|---|
2021-12-31 | 2,776.222 | 355.483 | 234.966 |
2021-09-30 | 2,726.572 | 342.012 | 252.347 |
2021-06-30 | 2,646.593 | 256.629 | 233.039 |
2021-03-31 | 2,542.959 | 284.047 | 218.431 |
2020-12-31 | 2,461.275 | 327.069 | 210.682 |
2020-09-30 | 2,436.912 | 281.997 | 184.154 |
FCN's Quality Factors
The “Quality” component of the POWR Ratings focuses on 31 different factors of a companies fundamentals and operational strength. Here are some key insights as we drill into the specifics of these quality attributes.- FCN has a Quality Grade of C, ranking ahead of 69.78% of graded US stocks.
- FCN's asset turnover comes in at 0.948 -- ranking 139th of 563 Business Services stocks.
- TCX, BAH, and HEES are the stocks whose asset turnover ratios are most correlated with FCN.
The table below shows FCN's key quality metrics over time.
Period | Asset Turnover | Gross Margin | ROIC |
---|---|---|---|
2021-09-30 | 0.948 | 0.314 | 0.259 |
2021-06-30 | 0.938 | 0.314 | 0.251 |
2021-03-31 | 0.920 | 0.316 | 0.256 |
2020-12-31 | 0.902 | 0.320 | 0.255 |
2020-09-30 | 0.893 | 0.322 | 0.234 |
2020-06-30 | 0.890 | 0.329 | 0.247 |
FCN Price Target
For more insight on analysts targets of FCN, see our FCN price target page. And for a list of of all stocks sorted by upside potential based on analyst target price, see our Top Price Target page.
Average Price Target | $173.67 | Average Broker Recommendation | 1.25 (Strong Buy) |
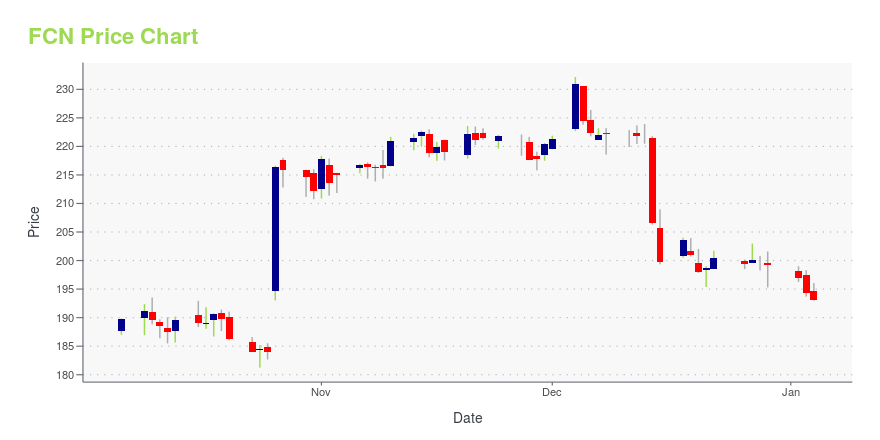
FCN Stock Price Chart Interactive Chart >
FCN Price/Volume Stats
Current price | $167.08 | 52-week high | $170.65 |
Prev. close | $165.00 | 52-week low | $131.50 |
Day low | $166.20 | Volume | 132,800 |
Day high | $168.13 | Avg. volume | 217,404 |
50-day MA | $160.99 | Dividend yield | N/A |
200-day MA | $148.93 | Market Cap | 5.76B |
FTI Consulting, Inc. (FCN) Company Bio
FTI Consulting helps clients overcome complex business challenges in areas such as investigations, litigation, mergers and acquisitions, regulatory issues, reputation management, strategic communications and restructuring. The company was founded in 1982 and is based in Washington, District of Columbia.
Latest FCN News From Around the Web
Below are the latest news stories about Fti Consulting Inc that investors may wish to consider to help them evaluate FCN as an investment opportunity.
FTI Consulting (FCN) Beats Q4 Earnings and Revenue EstimatesFTI Consulting (FCN) delivered earnings and revenue surprises of 9.71% and 0.74%, respectively, for the quarter ended December 2021. Do the numbers hold clues to what lies ahead for the stock? |
FTI Consulting Reports Fourth Quarter and Full Year 2021 Financial ResultsFourth Quarter 2021 Revenues of $676.2 Million, Up 8% Compared to $626.6 Million in Prior Year Quarter Fourth Quarter 2021 EPS of $1.07, Down 32% Compared to $1.57 in Prior Year Quarter; Fourth Quarter 2021 Adjusted EPS of $1.13, Down 30% Compared to $1.61 in Prior Year QuarterFull Year 2021 Revenues of $2.776 Billion, Up 13% Compared to $2.461 Billion in Prior YearFull Year 2021 EPS of $6.65, Up 17% Compared to $5.67 in Prior Year; Full Year 2021 Adjusted EPS of $6.76, Up 13% Compared to $5.99 |
FTI Consulting Announces Earnings Call Time Change; Fourth Quarter and Full Year 2021 Earnings Call to Occur on February 24, 2022 at 3:00 p.m. Eastern TimeWASHINGTON, Feb. 23, 2022 (GLOBE NEWSWIRE) -- FTI Consulting, Inc. (NYSE: FCN) today announced that it has changed the time of its previously scheduled earnings conference call due to an unavoidable last-minute scheduling conflict. The Company will now host a conference call to discuss results for the fourth quarter and full year 2021 on Thursday, February 24, 2022, at 3:00 p.m. Eastern Time. The conference call was previously scheduled for 9:00 a.m. Eastern Time on February 24, 2022. The confer |
FTI Consulting U.S. Loan Market Survey: Lenders Expect Slightly More Workout Activity in 2022WASHINGTON, Feb. 23, 2022 (GLOBE NEWSWIRE) -- FTI Consulting, Inc. (NYSE: FCN) today released the findings of its 2022 U.S. Loan Market Survey, which provides insight into the impact of COVID-19, inflation and other economic trends on the U.S. loan industry, along with expectations for leveraged credit market conditions this year. Following 2021’s sharp fall in workout activity, respondents to this year’s survey foresee activity modestly increasing. Nearly half of respondents (47%) expect slight |
Earnings Preview: FTI Consulting (FCN) Q4 Earnings Expected to DeclineFTI Consulting (FCN) doesn't possess the right combination of the two key ingredients for a likely earnings beat in its upcoming report. Get prepared with the key expectations. |
FCN Price Returns
1-mo | 7.41% |
3-mo | 14.78% |
6-mo | 13.57% |
1-year | 21.47% |
3-year | 102.64% |
5-year | 383.87% |
YTD | 8.90% |
2021 | 37.33% |
2020 | 0.96% |
2019 | 66.06% |
2018 | 55.12% |
2017 | -4.70% |
Continue Researching FCN
Want to see what other sources are saying about Fti Consulting Inc's financials and stock price? Try the links below:Fti Consulting Inc (FCN) Stock Price | Nasdaq
Fti Consulting Inc (FCN) Stock Quote, History and News - Yahoo Finance
Fti Consulting Inc (FCN) Stock Price and Basic Information | MarketWatch
Loading social stream, please wait...