Focus Universal Inc. (FCUV): Price and Financial Metrics
FCUV Price/Volume Stats
Current price | $0.41 | 52-week high | $2.73 |
Prev. close | $0.45 | 52-week low | $0.31 |
Day low | $0.40 | Volume | 671 |
Day high | $0.47 | Avg. volume | 116,512 |
50-day MA | $0.77 | Dividend yield | N/A |
200-day MA | $1.47 | Market Cap | 26.26M |
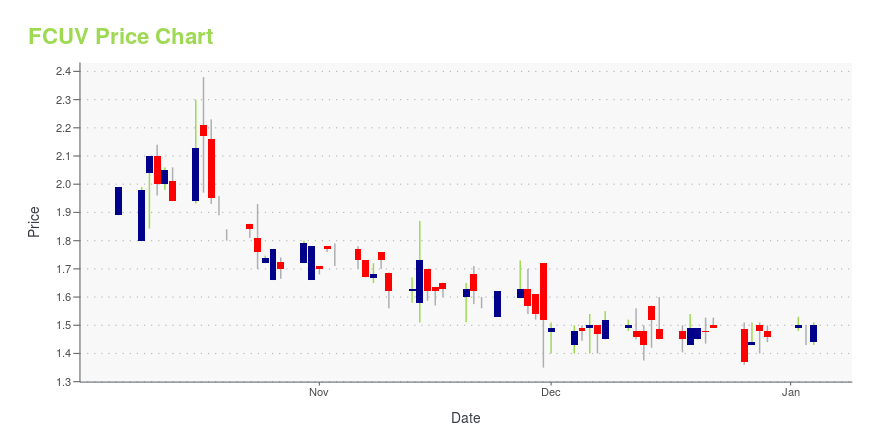
FCUV Stock Price Chart Interactive Chart >
FCUV POWR Grades
- Growth is the dimension where FCUV ranks best; there it ranks ahead of 87.31% of US stocks.
- FCUV's strongest trending metric is Sentiment; it's been moving up over the last 32 days.
- FCUV ranks lowest in Value; there it ranks in the 1st percentile.
FCUV Stock Summary
- FCUV's went public 2.35 years ago, making it older than just 4.59% of listed US stocks we're tracking.
- FCUV's price/sales ratio is 115.61; that's higher than the P/S ratio of 97.91% of US stocks.
- With a year-over-year growth in debt of 536.07%, FOCUS UNIVERSAL INC's debt growth rate surpasses 98.14% of about US stocks.
- If you're looking for stocks that are quantitatively similar to FOCUS UNIVERSAL INC, a group of peers worth examining would be UUUU, TMDX, ACON, FARO, and RCEL.
- Visit FCUV's SEC page to see the company's official filings. To visit the company's web site, go to www.focusuniversal.com.
FCUV Valuation Summary
- FCUV's EV/EBIT ratio is -23.5; this is 210.85% lower than that of the median Technology stock.
- FCUV's price/earnings ratio has moved up 79.3 over the prior 28 months.
Below are key valuation metrics over time for FCUV.
Stock | Date | P/S | P/B | P/E | EV/EBIT |
---|---|---|---|---|---|
FCUV | 2023-12-08 | 117.1 | 20.3 | -23.7 | -23.5 |
FCUV | 2023-12-07 | 113.3 | 19.6 | -22.9 | -22.7 |
FCUV | 2023-12-06 | 115.6 | 20.0 | -23.4 | -23.2 |
FCUV | 2023-12-05 | 114.0 | 19.8 | -23.1 | -22.9 |
FCUV | 2023-12-04 | 114.0 | 19.8 | -23.1 | -22.9 |
FCUV | 2023-12-01 | 114.9 | 19.9 | -23.2 | -23.0 |
FCUV Growth Metrics
- Its year over year net income to common stockholders growth rate is now at -91.85%.
- The 5 year price growth rate now stands at 200%.
- Its 2 year price growth rate is now at 146.22%.
The table below shows FCUV's growth in key financial areas (numbers in millions of US dollars).
Date | Revenue | Operating Cash Flow | Net Income to Common Stock |
---|---|---|---|
2022-09-30 | 0.456989 | -3.16675 | -4.592809 |
2022-06-30 | 1.031112 | -3.0136 | -4.988543 |
2022-03-31 | 1.22815 | -2.691913 | -4.407391 |
2021-12-31 | 1.434446 | -2.228405 | -3.220977 |
2021-09-30 | 1.649727 | -1.726391 | -3.049195 |
2021-06-30 | 1.558953 | -1.735902 | -2.149801 |
FCUV's Quality Factors
The “Quality” component of the POWR Ratings focuses on 31 different factors of a companies fundamentals and operational strength. Here are some key insights as we drill into the specifics of these quality attributes.- FCUV has a Quality Grade of D, ranking ahead of 10.81% of graded US stocks.
- FCUV's asset turnover comes in at 0.252 -- ranking 62nd of 76 Measuring and Control Equipment stocks.
- WAT, TRMB, and TER are the stocks whose asset turnover ratios are most correlated with FCUV.
The table below shows FCUV's key quality metrics over time.
Period | Asset Turnover | Gross Margin | ROIC |
---|---|---|---|
2021-06-30 | 0.252 | 0.202 | -0.372 |
2021-06-30 | 0.252 | 0.202 | -0.372 |
2021-03-31 | 0.278 | 0.221 | -0.420 |
2020-12-31 | 0.272 | 0.169 | -0.504 |
2020-12-31 | 0.272 | 0.169 | -0.504 |
2020-09-30 | 0.267 | 0.074 | -0.671 |
Focus Universal Inc. (FCUV) Company Bio
Focus Universal, Inc. engages in the development and manufacture of universal smart devices. Its technology features a Universal Smart Instrumentation Platform (USIP), a hardware and software integration platform that provides solutions for embedded design, industrial control and monitoring. It also offers Ubiquitor, universal smart controller, and sensors. The company was founded by Desheng Wang on December 4, 2012 and is headquartered in Ontario, CA.
Latest FCUV News From Around the Web
Below are the latest news stories about FOCUS UNIVERSAL INC that investors may wish to consider to help them evaluate FCUV as an investment opportunity.
Focus Universal to Debut Ubiquitors at 12th Annual MJBizCon Expo and 2024 Annual Conference & California School Business ExpoONTARIO, CA and LOS ANGELES, CA / ACCESSWIRE / October 17, 2023 / Focus Universal Inc. (NASDAQ:FCUV) ("Focus" or the "Company"), a provider of patented hardware and software design technologies for Internet of Things (IoT) and 5G announced today that ... |
Focus Universal Inc. and Smart AVX Wins Industry Award at InfoComm 2023Focus Universal Inc. (NASDAQ:FCUV)("Focus" or the "Company"), a provider of patented hardware and software design technologies for Internet of Things (IoT) and 5G, is pleased to announce today that it received an industry award during a successful InfoComm 2023. InfoComm is North America's largest technology exhibition and conference focused on the pro AV industry. |
Focus Universal Inc. to Showcase Wide Array of Innovative AVX Branded LED Displays at InfoComm 2023Focus Universal Inc. (NASDAQ:FCUV)("Focus" or the "Company"), a provider of patented hardware and software design technologies for Internet of Things (IoT) and 5G, today announced that it will participate at InfoComm 2023 at the Orange County Convention Center in Orlando, FL from June 14-16. |
Focus Universal Inc. Announces Share Repurchase ProgramFocus Universal Inc. (NASDAQ:FCUV)("Focus" or the "Company"), a provider of patented hardware and software design technologies for Internet of Things (IoT) and 5G announced today that its Board of Directors has approved a share repurchase program with authorization to purchase up to $7 million of its common stock. |
Focus Universal Inc. Adds to Intellectual Property Portfolio with Two New PatentsFocus Universal Inc. (NASDAQ:FCUV)("Focus" or the "Company"), a provider of patented hardware and software design technologies for Internet of Things (IoT) and 5G, provided an update on its patent portfolio. |
FCUV Price Returns
1-mo | 20.23% |
3-mo | -71.92% |
6-mo | -78.87% |
1-year | -83.13% |
3-year | N/A |
5-year | N/A |
YTD | -71.92% |
2023 | -65.83% |
2022 | -27.65% |
2021 | N/A |
2020 | N/A |
2019 | N/A |
Loading social stream, please wait...