
First Guaranty Bancshares, Inc. (FGBI): Price and Financial Metrics
FGBI Price/Volume Stats
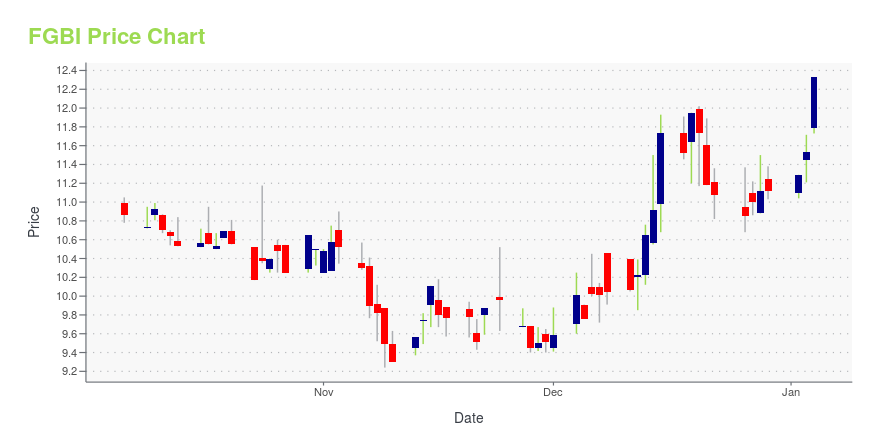
| Current price | $10.34 | 52-week high | $13.91 |
| Prev. close | $10.03 | 52-week low | $8.39 |
| Day low | $9.94 | Volume | 16,824 |
| Day high | $10.34 | Avg. volume | 11,150 |
| 50-day MA | $9.91 | Dividend yield | 6.29% |
| 200-day MA | $10.58 | Market Cap | 129.30M |
FGBI Stock Price Chart Interactive Chart >
First Guaranty Bancshares, Inc. (FGBI) Company Bio
First Guaranty Bancshares, Inc. operates as the bank holding company for First Guaranty Bank that provides commercial banking services to businesses, professionals, and individuals in Louisiana.The company was founded in 1934 and is based in Hammond, Louisiana.
Latest FGBI News From Around the Web
Below are the latest news stories about FIRST GUARANTY BANCSHARES INC that investors may wish to consider to help them evaluate FGBI as an investment opportunity.
FVCBankcorp (FVCB) Soars 5.9%: Is Further Upside Left in the Stock?FVCBankcorp (FVCB) saw its shares surge in the last session with trading volume being higher than average. The latest trend in earnings estimate revisions may not translate into further price increase in the near term. |
Don't Race Out To Buy First Guaranty Bancshares, Inc. (NASDAQ:FGBI) Just Because It's Going Ex-DividendFirst Guaranty Bancshares, Inc. ( NASDAQ:FGBI ) stock is about to trade ex-dividend in four days. The ex-dividend date... |
First Guaranty Bancshares (NASDAQ:FGBI) Has Announced A Dividend Of $0.16First Guaranty Bancshares, Inc. ( NASDAQ:FGBI ) has announced that it will pay a dividend of $0.16 per share on the... |
First Guaranty Bancshares (NASDAQ:FGBI) Is Due To Pay A Dividend Of $0.16The board of First Guaranty Bancshares, Inc. ( NASDAQ:FGBI ) has announced that it will pay a dividend on the 29th of... |
First Guaranty Bancshares, Inc. Declares 122nd Consecutive Quarterly Cash Dividend to ShareholdersHAMMOND, La., Nov. 21, 2023 (GLOBE NEWSWIRE) -- On November 16, 2023 the Board of Directors of First Guaranty Bancshares, Inc. (“First Guaranty”) declared a quarterly cash dividend on First Guaranty’s outstanding shares of common stock of $0.16 per share. The dividend will be payable to shareholders of record as of December 22, 2023 and is expected to be paid on December 29, 2023. This is the 122nd consecutive quarterly dividend paid to common shareholders. Sincerely, Alton B. LewisPresident and |
FGBI Price Returns
| 1-mo | 19.40% |
| 3-mo | 1.48% |
| 6-mo | -16.45% |
| 1-year | -17.85% |
| 3-year | -31.91% |
| 5-year | -35.66% |
| YTD | -3.83% |
| 2023 | -50.16% |
| 2022 | 18.18% |
| 2021 | 30.39% |
| 2020 | -14.65% |
| 2019 | -3.32% |
FGBI Dividends
| Ex-Dividend Date | Type | Payout Amount | Change | ||||||
|---|---|---|---|---|---|---|---|---|---|
| Loading, please wait... | |||||||||
Continue Researching FGBI
Here are a few links from around the web to help you further your research on First Guaranty Bancshares Inc's stock as an investment opportunity:First Guaranty Bancshares Inc (FGBI) Stock Price | Nasdaq
First Guaranty Bancshares Inc (FGBI) Stock Quote, History and News - Yahoo Finance
First Guaranty Bancshares Inc (FGBI) Stock Price and Basic Information | MarketWatch
Loading social stream, please wait...