
Full House Resorts, Inc. (FLL): Price and Financial Metrics
FLL Price/Volume Stats
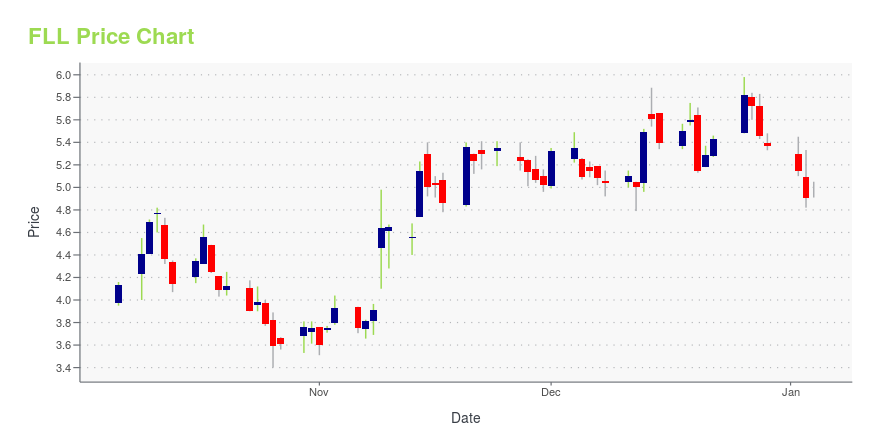
| Current price | $5.79 | 52-week high | $6.63 |
| Prev. close | $5.62 | 52-week low | $3.40 |
| Day low | $5.74 | Volume | 56,400 |
| Day high | $5.90 | Avg. volume | 98,896 |
| 50-day MA | $5.06 | Dividend yield | N/A |
| 200-day MA | $4.96 | Market Cap | 200.55M |
FLL Stock Price Chart Interactive Chart >
Full House Resorts, Inc. (FLL) Company Bio
Full House Resorts, Inc. owns, develops, operates, manages, leases, and invests in casinos, and related hospitality and entertainment facilities in the United States. The company owns and operates the Silver Slipper Casino and Hotel in Hancock County, Mississippi, which has 855 slot machines and 24 table games, a surface parking lot, approximately 800-space parking garage, and a 129-room hotel; a fine-dining restaurant, a buffet, and a quick-service restaurant, as well as oyster, casino, and beachfront bars; and 37-space beachfront RV park. It also owns and operates the Bronco Billy's Casino and Hotel in Cripple Creek, Colorado that has gaming space, 36 hotel rooms, and various acres of surface parking, as well as 1 steakhouse and 4 casual dining outlets. In addition, the company owns and operates the Rising Star Casino Resort in Rising Sun, Indiana, which has 825 slot machines and 24 table games; a land-based pavilion with approximately 30,000 square feet of meeting and convention space; a 190-room hotel; a 56-space RV park; surface parking; an 18-hole golf course on approximately 311 acres; and 5 dining outlets, as well as a leased 104-room hotel. Further, it owns and operates the Stockman's Casino that is located in Fallon, Nevada, which has 219 slot machines and 4 table games, a bar, a fine-dining restaurant, and a coffee shop, and approximately 300 surface parking spaces; and the Grand Lodge Casino that has 269 slot machines and 17 table games, which is integrated into the Hyatt Regency Lake Tahoe Resort, Spa and Casino in Incline Village, Nevada. Full House Resorts, Inc. was founded in 1987 and is headquartered in Las Vegas, Nevada.
Latest FLL News From Around the Web
Below are the latest news stories about FULL HOUSE RESORTS INC that investors may wish to consider to help them evaluate FLL as an investment opportunity.
Chamonix, Colorado’s Newest and Most Luxurious Casino Hotel, Opens at Noon on Wednesday, December 27, 2023Located in charming Cripple Creek, Chamonix is conveniently located less than an hour from Colorado Springs and approximately two hours from Denver CRIPPLE CREEK, Colo., Dec. 26, 2023 (GLOBE NEWSWIRE) -- Full House Resorts, Inc. (Nasdaq: FLL) today announced the opening details for its newest gaming destination – Chamonix Casino Hotel. Chamonix’s stylish new casino and luxurious 300-guestroom hotel effortlessly blend Colorado comfort with classic European elegance. It is located in historic Crip |
Those who invested in Full House Resorts (NASDAQ:FLL) five years ago are up 145%The most you can lose on any stock (assuming you don't use leverage) is 100% of your money. But on the bright side, you... |
Eric Green Bought 6.7% More Shares In Full House ResortsWhilst it may not be a huge deal, we thought it was good to see that the Full House Resorts, Inc. ( NASDAQ:FLL... |
Full House Resorts, Inc. (NASDAQ:FLL) Q3 2023 Earnings Call TranscriptFull House Resorts, Inc. (NASDAQ:FLL) Q3 2023 Earnings Call Transcript November 8, 2023 Operator: Greetings, and welcome to the Full House Resorts Third Quarter Earnings Call. At this time, all participants are in a listen-only mode. A brief question-and-answer session will follow the formal presentation. [Operator Instructions] As a reminder, this conference is being recorded. […] |
Full House Resorts Inc (FLL) Reports Substantial Growth in Q3 2023 EarningsRevenue and Adjusted EBITDA Surge as The Temporary by American Place Gains Traction |
FLL Price Returns
| 1-mo | 18.40% |
| 3-mo | 7.62% |
| 6-mo | 18.89% |
| 1-year | -8.24% |
| 3-year | -29.65% |
| 5-year | 228.98% |
| YTD | 7.82% |
| 2023 | -28.59% |
| 2022 | -37.90% |
| 2021 | 208.14% |
| 2020 | 17.31% |
| 2019 | 65.84% |
Continue Researching FLL
Want to do more research on Full House Resorts Inc's stock and its price? Try the links below:Full House Resorts Inc (FLL) Stock Price | Nasdaq
Full House Resorts Inc (FLL) Stock Quote, History and News - Yahoo Finance
Full House Resorts Inc (FLL) Stock Price and Basic Information | MarketWatch
Loading social stream, please wait...