FingerMotion, Inc. (FNGR): Price and Financial Metrics
FNGR Price/Volume Stats
| Current price | $2.11 | 52-week high | $7.97 |
| Prev. close | $2.11 | 52-week low | $1.85 |
| Day low | $2.02 | Volume | 88,433 |
| Day high | $2.16 | Avg. volume | 322,613 |
| 50-day MA | $2.60 | Dividend yield | N/A |
| 200-day MA | $3.32 | Market Cap | 111.22M |
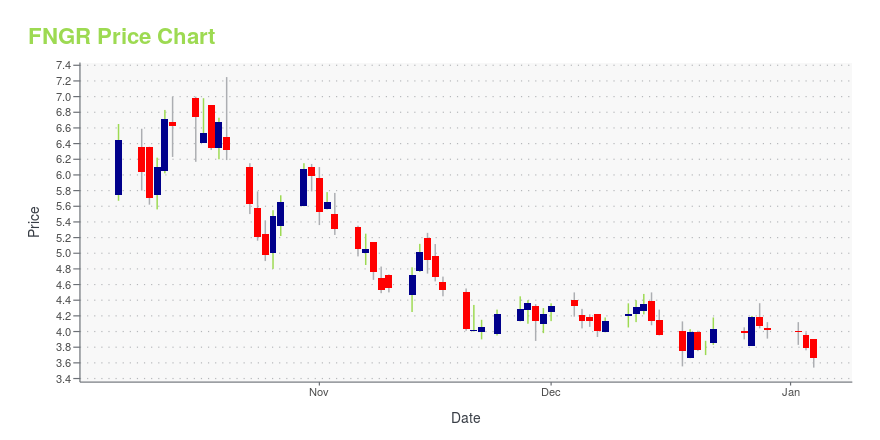
FNGR Stock Price Chart Interactive Chart >
FingerMotion, Inc. (FNGR) Company Bio
FingerMotion, Inc., a mobile services and data company, provides mobile payment and recharge platform solutions in China. It also develops data analysis application platform. FingerMotion, Inc. is headquartered in New York, New York.
Latest FNGR News From Around the Web
Below are the latest news stories about FINGERMOTION INC that investors may wish to consider to help them evaluate FNGR as an investment opportunity.
3 Hypergrowth Penny Stocks That Can Turn $5K Into $100KThese under-the-radar hypergrowth penny stocks have quadruple-digit upside potential once the turbulence subsides. |
MULN Stock: Mullen Is Lawyering Up to Review Financing, Funding InitiativesMULN stock is trading higher after the company announced that it had hired The Basile Law Firm to assist with funding opportunities. |
FingerMotion provides Litigation Update on Short Selling Research FirmSINGAPORE / ACCESSWIRE / November 17, 2023 / FingerMotion, Inc. (NASDAQ:FNGR) (the "Company" or "FingerMotion"), a mobile services and data company, is providing a litigation update to the market regarding its newly filed lawsuit against Capybara ... |
Investors in FingerMotion (NASDAQ:FNGR) have seen strong returns of 118% over the past five yearsIt might be of some concern to shareholders to see the FingerMotion, Inc. ( NASDAQ:FNGR ) share price down 24% in the... |
7 Under-the-Radar Growth Stocks Ready to Make a SplashBy being involved in some of the most creative industries, these growth stocks help you capitalize on emerging trends and technologies. |
FNGR Price Returns
| 1-mo | -17.25% |
| 3-mo | -41.06% |
| 6-mo | -7.05% |
| 1-year | -54.33% |
| 3-year | -65.58% |
| 5-year | -49.28% |
| YTD | -47.51% |
| 2023 | 43.06% |
| 2022 | -60.48% |
| 2021 | -29.36% |
| 2020 | 1,084.12% |
| 2019 | -70.69% |


Loading social stream, please wait...