Forestar Group Inc. (FOR): Price and Financial Metrics

Forestar Group Inc. (FOR): $20.70

0.03 (+0.15%)

POWR Rating

Component Grades

Momentum

C

Stability

C

Sentiment

Quality

C

Add FOR to Watchlist
Sign Up

Industry: Real Estate Services

Industry

F

Ranked

#11 of 42

in industry

FOR Price/Volume Stats

Current price $20.70 52-week high $20.96
Prev. close $20.67 52-week low $10.28
Day low $20.54 Volume 122,200
Day high $20.96 Avg. volume 112,150
50-day MA $17.87 Dividend yield N/A
200-day MA $14.73 Market Cap 1.03B

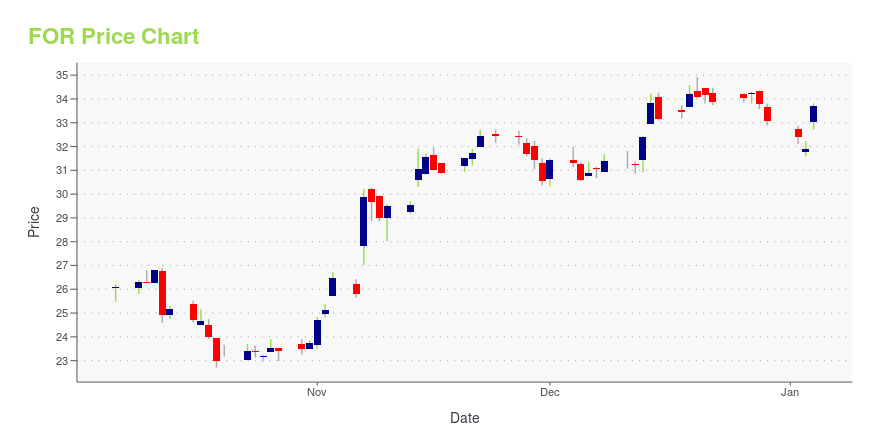
FOR Stock Price Chart Interactive Chart >

FOR POWR Grades

  • Sentiment is the dimension where FOR ranks best; there it ranks ahead of 88.39% of US stocks.
  • FOR's strongest trending metric is Growth; it's been moving down over the last 179 days.
  • FOR ranks lowest in Growth; there it ranks in the 20th percentile.

FOR Stock Summary

  • Of note is the ratio of FORESTAR GROUP INC's sales and general administrative expense to its total operating expenses; 98.64% of US stocks have a lower such ratio.
  • The ratio of debt to operating expenses for FORESTAR GROUP INC is higher than it is for about 88.91% of US stocks.
  • Revenue growth over the past 12 months for FORESTAR GROUP INC comes in at -22.6%, a number that bests only 10.2% of the US stocks we're tracking.
  • Stocks with similar financial metrics, market capitalization, and price volatility to FORESTAR GROUP INC are MGRC, LGIH, TMHC, TOL, and MGPI.
  • FOR's SEC filings can be seen here. And to visit FORESTAR GROUP INC's official web site, go to www.forestar.com.

FOR Valuation Summary

  • FOR's price/earnings ratio is 7.3; this is 68.26% lower than that of the median Real Estate stock.
  • Over the past 188 months, FOR's price/earnings ratio has gone down 9.2.

Below are key valuation metrics over time for FOR.

Stock Date P/S P/B P/E EV/EBIT
FOR 2023-05-11 0.8 0.8 7.3 7.8
FOR 2023-05-10 0.8 0.8 7.2 7.8
FOR 2023-05-09 0.8 0.8 7.2 7.7
FOR 2023-05-08 0.8 0.8 7.2 7.7
FOR 2023-05-05 0.8 0.8 7.1 7.6
FOR 2023-05-04 0.8 0.8 7.1 7.6

FOR Growth Metrics

    Its 3 year cash and equivalents growth rate is now at 184.65%.
  • The year over year net income to common stockholders growth rate now stands at 74.65%.
  • The 4 year net cashflow from operations growth rate now stands at -489.15%.
Over the past 34 months, FOR's revenue has gone up $597,400,000.

The table below shows FOR's growth in key financial areas (numbers in millions of US dollars).

Date Revenue Operating Cash Flow Net Income to Common Stock
2022-12-31 1,328.2 53.1 159.1
2022-09-30 1,519.1 108.7 178.8
2022-06-30 1,556.4 27.3 172
2022-03-31 1,560.8 23 148.1
2021-12-31 1,426.3 -138.6 128.7
2021-09-30 1,325.8 -303.1 110.2

FOR Price Target

For more insight on analysts targets of FOR, see our FOR price target page. And for a list of of all stocks sorted by upside potential based on analyst target price, see our Top Price Target page.

Average Price Target $29.00 Average Broker Recommendation 1.3 (Strong Buy)

Forestar Group Inc. (FOR) Company Bio


Forestar Group Inc. engages in the provision of real estate business. It acquires land and develops infrastructure for single-family residential communities, and its revenues generally come from sales of residential single-family finished lots to local, regional, and national homebuilders. The company was founded in 2007 and is headquartered in Arlington, TX.


FOR Latest News Stream


Event/Time News Detail
Loading, please wait...

FOR Latest Social Stream


Loading social stream, please wait...

View Full FOR Social Stream

Latest FOR News From Around the Web

Below are the latest news stories about FORESTAR GROUP INC that investors may wish to consider to help them evaluate FOR as an investment opportunity.

Are Investors Undervaluing Forestar Group (FOR) Right Now?

Here at Zacks, our focus is on the proven Zacks Rank system, which emphasizes earnings estimates and estimate revisions to find great stocks. Nevertheless, we are always paying attention to the latest value, growth, and momentum trends to underscore strong picks.

Yahoo | May 31, 2023

Zacks Industry Outlook Highlights CBRE Group, Forestar Group and Green Brick Partners

CBRE Group, Forestar Group and Green Brick Partners have been highlighted in this Industry Outlook article.

Yahoo | May 26, 2023

2 Real Estate Development Stocks to Bet on as Industry Rebounds

Amid low supply, Real Estate Development industry players like FOR and GBRK are likely to benefit from the improving demand for several trending real-estate property types and new-age real estate developments.

Yahoo | May 25, 2023

The Zacks Analyst Blog Highlights Forestar Group, Green Brick Partners, M.D.C. Holdings, Meritage Homes and J Sainsbury

Forestar Group, Green Brick Partners, M.D.C. Holdings, Meritage Homes and J Sainsbury are part of the Zacks top Analyst Blog.

Yahoo | May 11, 2023

5 Mid-Cap Stocks on a Roll

People seem to be buying these stocks, and it seems for good reason.

Yahoo | May 10, 2023

Read More 'FOR' Stories Here

FOR Price Returns

1-mo 5.67%
3-mo 44.35%
6-mo 37.18%
1-year 25.99%
3-year 31.60%
5-year -12.10%
YTD 34.33%
2022 -29.15%
2021 7.78%
2020 -3.21%
2019 50.54%
2018 -37.05%

Continue Researching FOR

Here are a few links from around the web to help you further your research on Forestar Group Inc's stock as an investment opportunity:

Forestar Group Inc (FOR) Stock Price | Nasdaq
Forestar Group Inc (FOR) Stock Quote, History and News - Yahoo Finance
Forestar Group Inc (FOR) Stock Price and Basic Information | MarketWatch

Get Free Updates

Join thousands of investors who get the latest news, insights and top rated picks from StockNews.com!