FlexShopper, Inc. (FPAY): Price and Financial Metrics

FlexShopper, Inc. (FPAY): $1.06

0.02 (+1.92%)

POWR Rating

Component Grades

Momentum

D

Stability

C

Sentiment

Quality

D

FPAY Price/Volume Stats

Current price $1.06 52-week high $2.47
Prev. close $1.04 52-week low $0.59
Day low $1.03 Volume 11,500
Day high $1.09 Avg. volume 45,708
50-day MA $1.32 Dividend yield N/A
200-day MA $1.09 Market Cap 23.06M

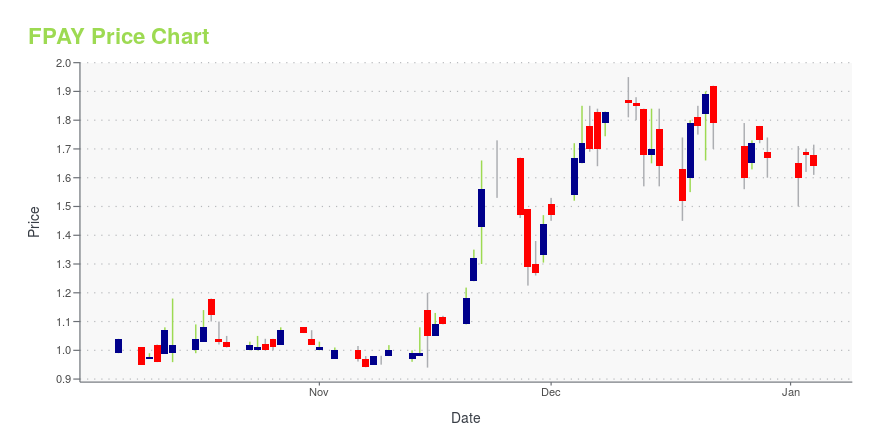
FPAY Stock Price Chart Interactive Chart >

FPAY Stock Summary

  • Of note is the ratio of FLEXSHOPPER INC's sales and general administrative expense to its total operating expenses; merely 0.26% of US stocks have a lower such ratio.
  • FPAY's price/sales ratio is 0.23; that's higher than the P/S ratio of just 7.38% of US stocks.
  • Shareholder yield, a measure of how much is returned to shareholders via dividends and share repurchases, for FPAY comes in at -53.37% -- higher than that of only 9.9% of stocks in our set.
  • Stocks with similar financial metrics, market capitalization, and price volatility to FLEXSHOPPER INC are NFG, ALE, MDU, SWX, and CRK.
  • FPAY's SEC filings can be seen here. And to visit FLEXSHOPPER INC's official web site, go to www.flexshopper.com.

FPAY Valuation Summary

  • In comparison to the median Industrials stock, FPAY's price/earnings ratio is 116.13% lower, now standing at -3.
  • Over the past 164 months, FPAY's EV/EBIT ratio has gone up 25.7.

Below are key valuation metrics over time for FPAY.

Stock Date P/S P/B P/E EV/EBIT
FPAY 2023-09-15 0.2 0.8 -3.0 18.2
FPAY 2023-09-14 0.2 0.8 -3.0 18.2
FPAY 2023-09-13 0.2 0.8 -2.8 18.0
FPAY 2023-09-12 0.2 0.8 -2.8 18.0
FPAY 2023-09-11 0.2 0.8 -2.8 18.1
FPAY 2023-09-08 0.2 0.8 -2.9 18.1

FPAY Growth Metrics

    The year over year price growth rate now stands at -64.49%.
  • The 2 year net cashflow from operations growth rate now stands at -3453.06%.
  • Its 3 year revenue growth rate is now at 38.96%.
Over the past 15 months, FPAY's revenue has gone up $6,554,576.

The table below shows FPAY's growth in key financial areas (numbers in millions of US dollars).

Date Revenue Operating Cash Flow Net Income to Common Stock
2022-09-30 122.7384 -39.96132 3.922063
2022-06-30 127.4579 -30.89304 11.89852
2022-03-31 121.5983 -18.63369 -1.548502
2021-12-31 125.4268 -11.25603 0.833675
2021-09-30 122.4747 -8.602849 -0.218518
2021-06-30 116.1839 -11.03685 -1.625176

FPAY's Quality Factors

The “Quality” component of the POWR Ratings focuses on 31 different factors of a companies fundamentals and operational strength. Here are some key insights as we drill into the specifics of these quality attributes.
  • FPAY has a Quality Grade of D, ranking ahead of 22.61% of graded US stocks.
  • FPAY's asset turnover comes in at 1.886 -- ranking 39th of 561 Business Services stocks.
  • EGAN, CRTO, and EXEL are the stocks whose asset turnover ratios are most correlated with FPAY.

The table below shows FPAY's key quality metrics over time.

Period Asset Turnover Gross Margin ROIC
2021-06-30 1.886 0.356 0.089
2021-03-31 1.884 0.342 0.066
2020-12-31 1.856 0.346 0.070
2020-09-30 1.890 0.330 0.057
2020-06-30 1.956 0.328 0.073
2020-03-31 1.979 0.327 0.071

FPAY Price Target

For more insight on analysts targets of FPAY, see our FPAY price target page. And for a list of of all stocks sorted by upside potential based on analyst target price, see our Top Price Target page.

Average Price Target $5.33 Average Broker Recommendation 1.5 (Moderate Buy)

FlexShopper, Inc. (FPAY) Company Bio


FlexShopper, Inc., through its wholly owned subsidiary, FlexShopper, LLC operates as an online lease-to-own (LTO) retailer and LTO payment solution provider. The company provides residential furniture, consumer electronics, computers, appliances, household accessories, and various other durable goods to consumers on a LTO basis to consumers of third-party retailers and e-tailers. It offers products through FlexShopper.com, an LTO e-commerce marketplace; e-commerce sites and in-store terminals by utilizing FlexShopper's patented LTO payment method; and facilitation of LTO transactions with retailers. The company was formerly known as Anchor Funding Services, Inc. and changed its name to FlexShopper, Inc. in October 2013. FlexShopper, Inc. was founded in 2003 and is based in Boca Raton, Florida.


FPAY Latest News Stream


Event/Time News Detail
Loading, please wait...

FPAY Latest Social Stream


Loading social stream, please wait...

View Full FPAY Social Stream

Latest FPAY News From Around the Web

Below are the latest news stories about FLEXSHOPPER INC that investors may wish to consider to help them evaluate FPAY as an investment opportunity.

Q2 2023 FlexShopper Inc Earnings Call

Q2 2023 FlexShopper Inc Earnings Call

Yahoo | August 16, 2023

Today’s Biggest Pre-Market Stock Movers: 10 Top Gainers and Losers on Tuesday

Pre-market stock movers are a hot topic with investors this morning and we're checking out the biggest ones worth watching on Tuesday!

William White on InvestorPlace | August 15, 2023

FlexShopper, Inc. Reports Second Quarter 2023 Financial Results

BOCA RATON, Fla., Aug. 14, 2023 (GLOBE NEWSWIRE) -- FlexShopper, Inc. (Nasdaq:FPAY) (“FlexShopper”), a leading national online lease-to-own (“LTO”) retailer and payment solution provider for underserved consumers, today announced its financial results for the quarter ended June 30, 2023. Results for Quarter Ended June 30, 2023 vs. Quarter Ended June 30, 2022: Total fundings decreased 11.0% to $27.5 million from $30.9 million consisting of gross lease originations decreasing 32.7% from $19.9 to $

Yahoo | August 14, 2023

Open Lending (LPRO) Q2 Earnings Match Estimates

Open Lending (LPRO) delivered earnings and revenue surprises of 0% and 7.39%, respectively, for the quarter ended June 2023. Do the numbers hold clues to what lies ahead for the stock?

Yahoo | August 8, 2023

Greystone Housing Impact Investors (GHI) Q2 Earnings and Revenues Top Estimates

Greystone Housing Impact (GHI) delivered earnings and revenue surprises of 93.18% and 6.81%, respectively, for the quarter ended June 2023. Do the numbers hold clues to what lies ahead for the stock?

Yahoo | August 3, 2023

Read More 'FPAY' Stories Here

FPAY Price Returns

1-mo 1.92%
3-mo -7.95%
6-mo 34.18%
1-year -44.21%
3-year -36.90%
5-year -9.40%
YTD 14.59%
2022 -60.64%
2021 -8.56%
2020 1.58%
2019 232.02%
2018 -79.95%

Continue Researching FPAY

Here are a few links from around the web to help you further your research on FlexShopper Inc's stock as an investment opportunity:

FlexShopper Inc (FPAY) Stock Price | Nasdaq
FlexShopper Inc (FPAY) Stock Quote, History and News - Yahoo Finance
FlexShopper Inc (FPAY) Stock Price and Basic Information | MarketWatch

Get Free Updates

Join thousands of investors who get the latest news, insights and top rated picks from StockNews.com!