
Friedman Industries Inc. (FRD): Price and Financial Metrics
FRD Price/Volume Stats
| Current price | $17.60 | 52-week high | $18.48 |
| Prev. close | $17.50 | 52-week low | $12.24 |
| Day low | $17.15 | Volume | 36,900 |
| Day high | $17.71 | Avg. volume | 24,248 |
| 50-day MA | $16.24 | Dividend yield | 0.92% |
| 200-day MA | $0.00 | Market Cap | 124.24M |
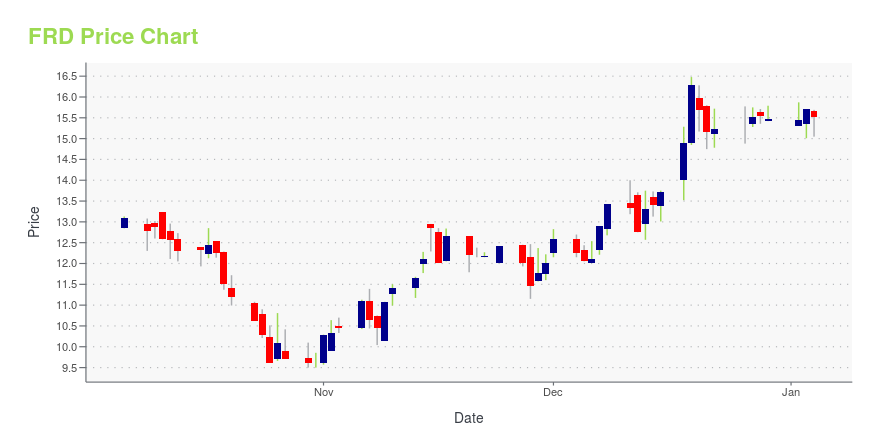
FRD Stock Price Chart Interactive Chart >
FRD Price Returns
| 1-mo | 11.19% |
| 3-mo | 7.92% |
| 6-mo | 1.07% |
| 1-year | 22.42% |
| 3-year | 71.84% |
| 5-year | 256.51% |
| YTD | 16.01% |
| 2024 | -0.26% |
| 2023 | 58.98% |
| 2022 | 5.34% |
| 2021 | 37.91% |
| 2020 | 15.73% |
FRD Dividends
| Ex-Dividend Date | Type | Payout Amount | Change | ||||||
|---|---|---|---|---|---|---|---|---|---|
| Loading, please wait... | |||||||||
Continue Researching FRD
Want to do more research on Friedman Industries Inc's stock and its price? Try the links below:Friedman Industries Inc (FRD) Stock Price | Nasdaq
Friedman Industries Inc (FRD) Stock Quote, History and News - Yahoo Finance
Friedman Industries Inc (FRD) Stock Price and Basic Information | MarketWatch
Loading social stream, please wait...