
Friedman Industries Inc. (FRD): Price and Financial Metrics
FRD Price/Volume Stats
| Current price | $17.28 | 52-week high | $19.52 |
| Prev. close | $17.55 | 52-week low | $9.50 |
| Day low | $17.26 | Volume | 10,329 |
| Day high | $17.80 | Avg. volume | 19,192 |
| 50-day MA | $16.67 | Dividend yield | 0.9% |
| 200-day MA | $15.96 | Market Cap | 120.44M |
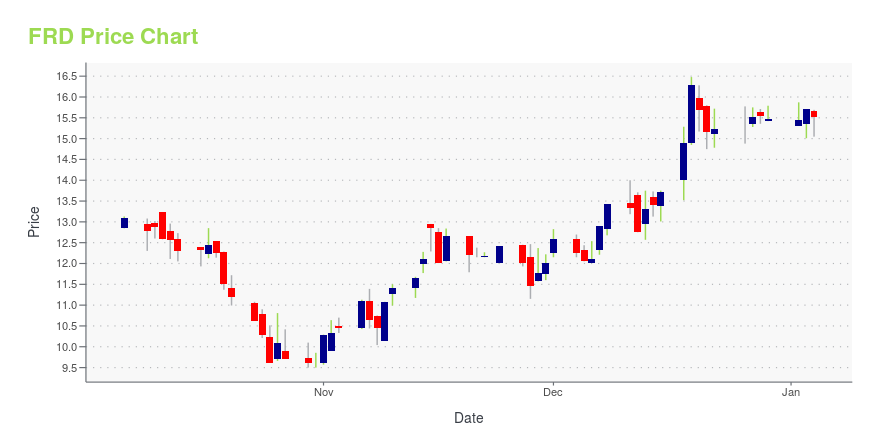
FRD Stock Price Chart Interactive Chart >
Latest FRD News From Around the Web
Below are the latest news stories about FRIEDMAN INDUSTRIES INC that investors may wish to consider to help them evaluate FRD as an investment opportunity.
Sizing Up Prospects for 3 Steel Stocks in the Wake of the Deal for U.S. SteelShares of U.S. Steel shot higher by 25% on Monday on news that the company will be acquired by Nippon Steel, Japan's largest steelmaker, for $14.9 billion. Created as the United States Steel Company in 1901, the iconic brand essentially began as a partnership that included business titans Andrew Carnegie, J.P. Morgan and Charles Schwab. The weak yen makes the deal more expensive from Nippon Steel's perspective, but the Tokyo-based steelmaker is willing to pay the price. |
FRIEDMAN INDUSTRIES, INCORPORATED ANNOUNCES SHARE REPURCHASE AND AUTHORIZATION OF ADDITIONAL SHARE REPURCHASE PROGRAMLONGVIEW, Texas, Dec. 18, 2023 (GLOBE NEWSWIRE) -- On December 13, 2023, Friedman Industries, Incorporated (the “Company”) repurchased 400,041 shares of the Company’s common stock from Metal One Corporation for an aggregate repurchase price of approximately $5.1 million. After the repurchase, the Company had 6,971,824 shares of common stock outstanding. In addition, the Board of Directors authorized a share repurchase program on December 13, 2023 under which the Company may repurchase up to 1,04 |
FRIEDMAN INDUSTRIES, INCORPORATED ANNOUNCES CASH DIVIDENDLONGVIEW, Texas, Dec. 13, 2023 (GLOBE NEWSWIRE) -- Friedman Industries, Incorporated (NYSE—American; Trading Symbol: FRD) The Board of Directors (the “Board”) of Friedman Industries, Incorporated, a Texas-based company engaged in pipe manufacturing, steel processing and steel and pipe distribution, declared on December 13, 2023, a cash dividend of $0.02 per share on the Common Stock of the Company. The Company will pay the cash dividend on February 16, 2024 to shareholders of record at the close |
Friedman Industries, Incorporated Announces Second Quarter Results and Provides Update on Strategic Growth InitiativesLONGVIEW, Texas, Nov. 14, 2023 (GLOBE NEWSWIRE) -- Friedman Industries, Incorporated (NYSE American: FRD) announced today its results of operations for the quarter ended September 30, 2023. September 30, 2023 Quarter Highlights: Net earnings of approximately $3.5 millionSales of approximately $130.7 million10% increase in sales volume over prior year quarter volumeWorking capital balance at quarter-end of approximately $129.9 million “Our second quarter results are a testament to our team’s abil |
Director Max Reichenthal Buys 2000 Shares of Friedman Industries Inc (FRD)On September 11, 2023, Max Reichenthal, a director at Friedman Industries Inc (FRD), purchased 2000 shares of the company. |
FRD Price Returns
| 1-mo | 11.09% |
| 3-mo | -11.00% |
| 6-mo | 0.03% |
| 1-year | 1.61% |
| 3-year | 41.15% |
| 5-year | 191.70% |
| YTD | 12.40% |
| 2023 | 58.98% |
| 2022 | 5.34% |
| 2021 | 37.91% |
| 2020 | 15.73% |
| 2019 | -12.71% |
FRD Dividends
| Ex-Dividend Date | Type | Payout Amount | Change | ||||||
|---|---|---|---|---|---|---|---|---|---|
| Loading, please wait... | |||||||||
Continue Researching FRD
Want to do more research on Friedman Industries Inc's stock and its price? Try the links below:Friedman Industries Inc (FRD) Stock Price | Nasdaq
Friedman Industries Inc (FRD) Stock Quote, History and News - Yahoo Finance
Friedman Industries Inc (FRD) Stock Price and Basic Information | MarketWatch
Loading social stream, please wait...