First Solar, Inc. (FSLR): Price and Financial Metrics
FSLR Price/Volume Stats
Current price | $145.38 | 52-week high | $232.00 |
Prev. close | $144.18 | 52-week low | $129.21 |
Day low | $142.59 | Volume | 4,314,100 |
Day high | $153.24 | Avg. volume | 2,318,778 |
50-day MA | $150.08 | Dividend yield | N/A |
200-day MA | $183.33 | Market Cap | 15.53B |
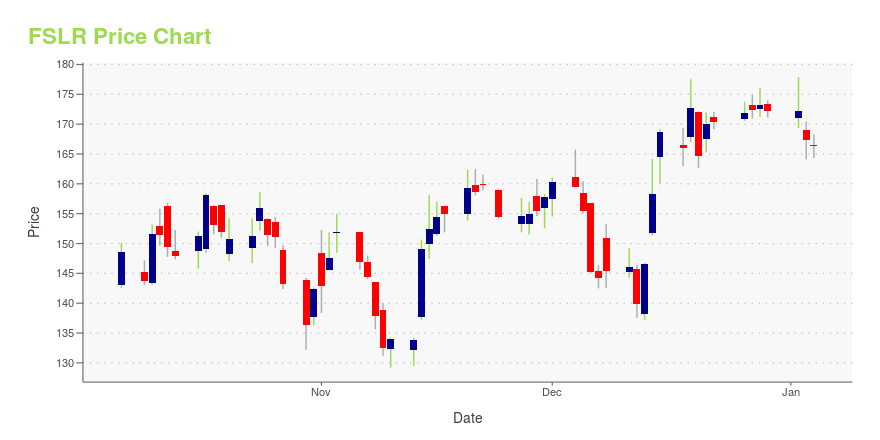
FSLR Stock Price Chart Interactive Chart >
FSLR POWR Grades
- FSLR scores best on the Growth dimension, with a Growth rank ahead of 92.9% of US stocks.
- The strongest trend for FSLR is in Sentiment, which has been heading up over the past 177 days.
- FSLR's current lowest rank is in the Stability metric (where it is better than 2.92% of US stocks).
FSLR Stock Summary
- With a market capitalization of $17,126,058,741, FIRST SOLAR INC has a greater market value than 88.38% of US stocks.
- With a year-over-year growth in debt of 92.35%, FIRST SOLAR INC's debt growth rate surpasses 90.96% of about US stocks.
- In terms of twelve month growth in earnings before interest and taxes, FIRST SOLAR INC is reporting a growth rate of 166.59%; that's higher than 92.82% of US stocks.
- Stocks that are quantitatively similar to FSLR, based on their financial statements, market capitalization, and price volatility, are OTEX, ONTO, FF, CBAT, and ILMN.
- FSLR's SEC filings can be seen here. And to visit FIRST SOLAR INC's official web site, go to www.firstsolar.com.
FSLR Valuation Summary
- In comparison to the median Technology stock, FSLR's price/sales ratio is 116.67% higher, now standing at 5.2.
- FSLR's price/sales ratio has moved down 12.7 over the prior 207 months.
Below are key valuation metrics over time for FSLR.
Stock | Date | P/S | P/B | P/E | EV/EBIT |
---|---|---|---|---|---|
FSLR | 2023-11-28 | 5.2 | 2.6 | 34.9 | 30.1 |
FSLR | 2023-11-27 | 5.2 | 2.6 | 34.9 | 30.0 |
FSLR | 2023-11-24 | 5.2 | 2.6 | 34.8 | 30.0 |
FSLR | 2023-11-22 | 5.4 | 2.7 | 36.0 | 31.1 |
FSLR | 2023-11-21 | 5.4 | 2.7 | 35.8 | 30.9 |
FSLR | 2023-11-20 | 5.4 | 2.7 | 35.9 | 31.0 |
FSLR Growth Metrics
- Its 4 year net income to common stockholders growth rate is now at 108.35%.
- The 5 year price growth rate now stands at 27.85%.
- Its year over year net income to common stockholders growth rate is now at -58.29%.

The table below shows FSLR's growth in key financial areas (numbers in millions of US dollars).
Date | Revenue | Operating Cash Flow | Net Income to Common Stock |
---|---|---|---|
2022-09-30 | 2,524.247 | 112.621 | 94.752 |
2022-06-30 | 2,478.818 | 288.967 | 189.123 |
2022-03-31 | 2,487.043 | 378.198 | 215.767 |
2021-12-31 | 2,923.377 | 237.559 | 468.693 |
2021-09-30 | 2,625.29 | 389.41 | 453.026 |
2021-06-30 | 2,969.351 | 291.986 | 562.86 |
FSLR's Quality Factors
The “Quality” component of the POWR Ratings focuses on 31 different factors of a companies fundamentals and operational strength. Here are some key insights as we drill into the specifics of these quality attributes.- FSLR has a Quality Grade of C, ranking ahead of 66.61% of graded US stocks.
- FSLR's asset turnover comes in at 0.417 -- ranking 156th of 208 Electronic Equipment stocks.
- APH, BELFA, and JCS are the stocks whose asset turnover ratios are most correlated with FSLR.
The table below shows FSLR's key quality metrics over time.
Period | Asset Turnover | Gross Margin | ROIC |
---|---|---|---|
2021-06-30 | 0.417 | 0.273 | 0.116 |
2021-03-31 | 0.422 | 0.260 | 0.104 |
2020-12-31 | 0.386 | 0.251 | 0.058 |
2020-09-30 | 0.491 | 0.244 | 0.033 |
2020-06-30 | 0.437 | 0.224 | 0.004 |
2020-03-31 | 0.428 | 0.209 | -0.005 |
FSLR Price Target
For more insight on analysts targets of FSLR, see our FSLR price target page. And for a list of of all stocks sorted by upside potential based on analyst target price, see our Top Price Target page.
Average Price Target | $98.05 | Average Broker Recommendation | 1.84 (Hold) |
First Solar, Inc. (FSLR) Company Bio
First Solar designs, manufactures and sells photovoltaic solar modules, and also develops, designs, constructs and sells PV solar power solutions. The Company operates through two segments: components and systems. The company was founded in 1999 and is based in Tempe, Arizona.
Latest FSLR News From Around the Web
Below are the latest news stories about FIRST SOLAR INC that investors may wish to consider to help them evaluate FSLR as an investment opportunity.
First Solar raised at Morgan Stanley after recent selloffMore on First Solar |
After Solar Sell-Off, Morgan Stanley Sees Upside For Panel Manufacturer First SolarMorgan Stanley says slump for panel manufacturing company First Solar has created a buying opportunity for FSLR stock. |
Solar stocks poised for comeback in 2024Rate cuts in 2024 could give solar stocks a boost after a difficult year. |
First Solar’s Selloff Should Be Over, Analyst Says. Why He Thinks the Stock Can Bounce Back.Morgan Stanley analyst Andrew Percoco upgraded shares of First Solar to Overweight from Equal Weight. |
Will solar energy stocks see the light in 2024?Solar energy stocks have been hurting in 2023 amid higher interest rates and alterations to adoption incentives in states like California. Coming off of 2023 headwinds, analysts are now expecting solar stocks to rebound on increased solar panel installations in 2024. Yahoo Finance’s Ines Ferré take a deep dive into the energy sector, breaking down solar energy forecasts from Citi and Morgan Stanley, and crude oil market outlooks going into an election year. For more expert insight and the latest market action, click here to watch this full episode of Yahoo Finance Live. |
FSLR Price Returns
1-mo | 8.56% |
3-mo | -18.95% |
6-mo | -25.82% |
1-year | -3.70% |
3-year | 67.99% |
5-year | 242.47% |
YTD | -2.94% |
2022 | 71.86% |
2021 | -11.89% |
2020 | 76.77% |
2019 | 31.81% |
2018 | -37.12% |
Continue Researching FSLR
Want to do more research on First Solar Inc's stock and its price? Try the links below:First Solar Inc (FSLR) Stock Price | Nasdaq
First Solar Inc (FSLR) Stock Quote, History and News - Yahoo Finance
First Solar Inc (FSLR) Stock Price and Basic Information | MarketWatch
Loading social stream, please wait...