Federal Signal Corporation (FSS): Price and Financial Metrics
GET POWR RATINGS... FREE!
FSS POWR Grades
- FSS scores best on the Sentiment dimension, with a Sentiment rank ahead of 86.99% of US stocks.
- FSS's strongest trending metric is Growth; it's been moving up over the last 179 days.
- FSS's current lowest rank is in the Value metric (where it is better than 16.75% of US stocks).
FSS Stock Summary
- FEDERAL SIGNAL CORP's stock had its IPO on January 1, 1986, making it an older stock than 93.48% of US equities in our set.
- With a price/earnings ratio of 30.66, FEDERAL SIGNAL CORP P/E ratio is greater than that of about 76.53% of stocks in our set with positive earnings.
- The price/operating cash flow metric for FEDERAL SIGNAL CORP is higher than 87.8% of stocks in our set with a positive cash flow.
- Stocks that are quantitatively similar to FSS, based on their financial statements, market capitalization, and price volatility, are NRC, SBCF, PCYG, WDFC, and MCFT.
- FSS's SEC filings can be seen here. And to visit FEDERAL SIGNAL CORP's official web site, go to www.federalsignal.com.
FSS Valuation Summary
- In comparison to the median Industrials stock, FSS's EV/EBIT ratio is 50.44% higher, now standing at 25.8.
- FSS's EV/EBIT ratio has moved up 8.2 over the prior 243 months.
Below are key valuation metrics over time for FSS.
Stock | Date | P/S | P/B | P/E | EV/EBIT |
---|---|---|---|---|---|
FSS | 2023-01-24 | 2.4 | 3.8 | 30.0 | 25.8 |
FSS | 2023-01-23 | 2.3 | 3.8 | 29.7 | 25.5 |
FSS | 2023-01-20 | 2.3 | 3.7 | 29.3 | 25.2 |
FSS | 2023-01-19 | 2.2 | 3.6 | 28.5 | 24.6 |
FSS | 2023-01-18 | 2.2 | 3.6 | 28.2 | 24.3 |
FSS | 2023-01-17 | 2.2 | 3.6 | 28.6 | 24.6 |
FSS Growth Metrics
- The 5 year net income to common stockholders growth rate now stands at 205.07%.
- Its year over year price growth rate is now at -16.49%.
- Its 2 year revenue growth rate is now at 2.51%.

The table below shows FSS's growth in key financial areas (numbers in millions of US dollars).
Date | Revenue | Operating Cash Flow | Net Income to Common Stock |
---|---|---|---|
2022-09-30 | 1,344.7 | 79.1 | 105.3 |
2022-06-30 | 1,296.6 | 84.9 | 102.7 |
2022-03-31 | 1,264.6 | 82.8 | 98.9 |
2021-12-31 | 1,213.2 | 101.8 | 100.6 |
2021-09-30 | 1,206.6 | 111.7 | 107.2 |
2021-06-30 | 1,188.1 | 110.5 | 103.3 |
FSS's Quality Factors
The “Quality” component of the POWR Ratings focuses on 31 different factors of a companies fundamentals and operational strength. Here are some key insights as we drill into the specifics of these quality attributes.- FSS has a Quality Grade of B, ranking ahead of 87.41% of graded US stocks.
- FSS's asset turnover comes in at 0.953 -- ranking 33rd of 68 Automobiles and Trucks stocks.
- WNC, ALSN, and MLR are the stocks whose asset turnover ratios are most correlated with FSS.
The table below shows FSS's key quality metrics over time.
Period | Asset Turnover | Gross Margin | ROIC |
---|---|---|---|
2021-06-30 | 0.953 | 0.252 | 0.192 |
2021-03-31 | 0.915 | 0.256 | 0.182 |
2020-12-31 | 0.928 | 0.260 | 0.185 |
2020-09-30 | 0.953 | 0.260 | 0.188 |
2020-06-30 | 0.987 | 0.262 | 0.196 |
2020-03-31 | 1.058 | 0.265 | 0.227 |
FSS Price Target
For more insight on analysts targets of FSS, see our FSS price target page. And for a list of of all stocks sorted by upside potential based on analyst target price, see our Top Price Target page.
Average Price Target | $47.50 | Average Broker Recommendation | 1.36 (Strong Buy) |
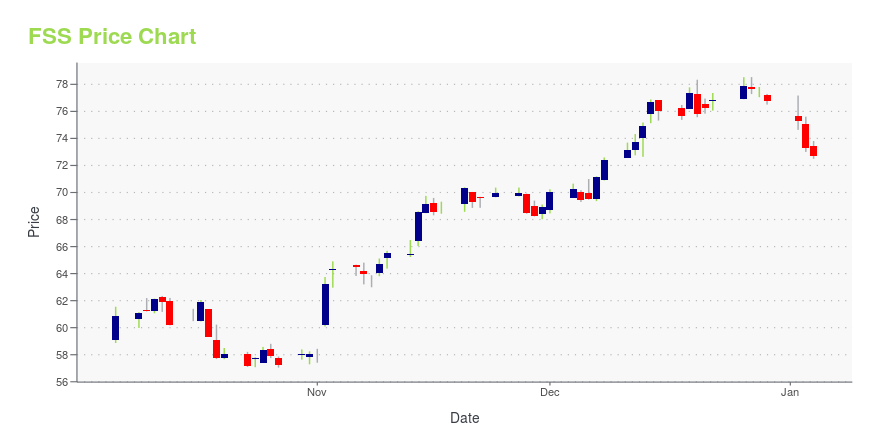
FSS Stock Price Chart Interactive Chart >
FSS Price/Volume Stats
Current price | $53.69 | 52-week high | $54.29 |
Prev. close | $53.61 | 52-week low | $31.86 |
Day low | $53.60 | Volume | 8,440 |
Day high | $53.84 | Avg. volume | 256,980 |
50-day MA | $48.52 | Dividend yield | 0.67% |
200-day MA | $41.43 | Market Cap | 3.26B |
Federal Signal Corporation (FSS) Company Bio
Federal Signal is a designer and manufacturer of products and total solutions that serve municipal, governmental, industrial and commercial customers. The Company operates three groups: Environmental Solutions, Safety and Security Systems and Fire Rescue. The company was founded in 1901 and is based in Oak Brook, Illinois.
Latest FSS News From Around the Web
Below are the latest news stories about FEDERAL SIGNAL CORP that investors may wish to consider to help them evaluate FSS as an investment opportunity.
Calculating The Fair Value Of Federal Signal Corporation (NYSE:FSS)How far off is Federal Signal Corporation ( NYSE:FSS ) from its intrinsic value? Using the most recent financial data... |
Federal Signal Completes Acquisition of Blasters, Inc.Federal Signal Corporation (NYSE: FSS) (the "Company"), a leader in environmental and safety solutions, today announced that it has completed the acquisition of substantially all the assets and operations of Blasters, Inc., a leading manufacturer of truck-mounted waterblasting equipment based in Tampa, Florida. The signing of the purchase agreement was previously announced on November 17, 2022. |
Returns At Federal Signal (NYSE:FSS) Are On The Way UpFinding a business that has the potential to grow substantially is not easy, but it is possible if we look at a few key... |
Is Now An Opportune Moment To Examine Federal Signal Corporation (NYSE:FSS)?Federal Signal Corporation ( NYSE:FSS ), is not the largest company out there, but it saw a significant share price... |
Federal Signal Corporation – Consensus Indicates Potential 6.9% UpsideFederal Signal Corporation found using ticker (FSS) have now 5 analysts in total covering the stock. The consensus rating is ''Buy''. The range between the high target price and low target price is between 54 and 45 and has a mean target at 50.6. With the stocks previous close at 47.32 this is indicating there is a potential upside of 6.9%. The 50 day MA is 45.06 while the 200 day moving average is 38.57. The company has a market cap of $2,837m. Company Website: https://www.federalsignal.com [stock_market_widget type="chart" template="basic" color="green" assets="FSS" range="6mo" interval="1d" axes="true" cursor="true" api="yf"] The potential market cap would be $3,033m based on the market concensus. Federal Signal Corporation, together with its subsidiaries, designs, manufactures, and ... |
FSS Price Returns
1-mo | 15.46% |
3-mo | 16.22% |
6-mo | 30.23% |
1-year | 41.94% |
3-year | 69.53% |
5-year | 183.56% |
YTD | 15.54% |
2022 | 8.22% |
2021 | 31.80% |
2020 | 3.99% |
2019 | 63.92% |
2018 | 0.39% |
FSS Dividends
Ex-Dividend Date | Type | Payout Amount | Change | ||||||
---|---|---|---|---|---|---|---|---|---|
Loading, please wait... |
Continue Researching FSS
Here are a few links from around the web to help you further your research on Federal Signal Corp's stock as an investment opportunity:Federal Signal Corp (FSS) Stock Price | Nasdaq
Federal Signal Corp (FSS) Stock Quote, History and News - Yahoo Finance
Federal Signal Corp (FSS) Stock Price and Basic Information | MarketWatch
Loading social stream, please wait...