
L.B. Foster Company (FSTR): Price and Financial Metrics
FSTR Price/Volume Stats
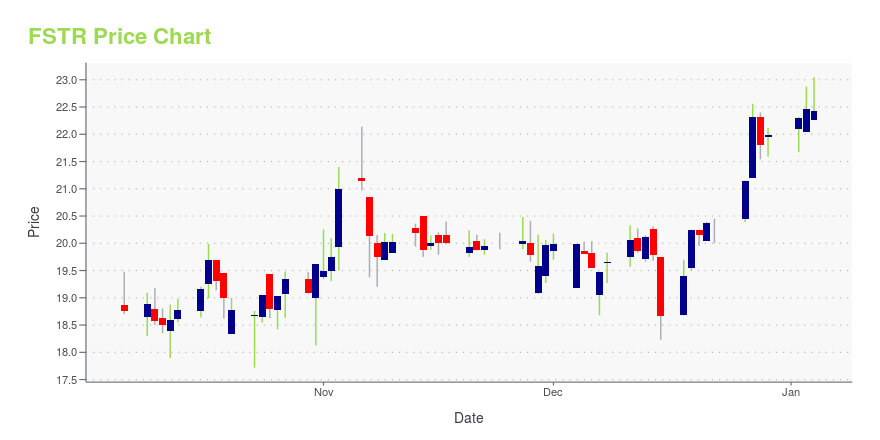
| Current price | $23.30 | 52-week high | $30.77 |
| Prev. close | $23.21 | 52-week low | $13.76 |
| Day low | $23.12 | Volume | 34,000 |
| Day high | $23.69 | Avg. volume | 60,015 |
| 50-day MA | $24.36 | Dividend yield | N/A |
| 200-day MA | $23.06 | Market Cap | 255.46M |
FSTR Stock Price Chart Interactive Chart >
L.B. Foster Company (FSTR) Company Bio
L.B. Foster Co. engages in providing products and services for the rail industry and solutions to support infrastructure projects. It operates through the following segments: Rail Technologies & Services and Infrastructure Solutions. The Rail Technologies & Services segment comprises of manufacturing and distribution businesses that provide products and services for freight and passenger railroads and industrial companies. The Infrastructure Solutions segment comprised of manufacturing, distribution, and service businesses that provide products and services for the transportation, energy, and general infrastructure markets in North America. The company was founded by Lee B. Foster in 1902 and is headquartered in Pittsburgh, PA.
Latest FSTR News From Around the Web
Below are the latest news stories about FOSTER L B CO that investors may wish to consider to help them evaluate FSTR as an investment opportunity.
L.B. Foster Company Announces the Expansion of its Board of Directors and Election of David J. MeyerPITTSBURGH, Dec. 21, 2023 (GLOBE NEWSWIRE) -- L.B. Foster Company (NASDAQ: FSTR), a global technology solutions provider of products and services for the rail and infrastructure markets, announced today that, effective January 1, 2024, its Board of Directors voted to expand its size to eight (8) members and elect Mr. David J. Meyer to the Board. Mr. Meyer brings a wide range of knowledge and skills to the board that includes over 28 years of manufacturing experience, including 23 years in the ra |
Sidoti Events, LLC's Virtual December Small-Cap ConferenceNEW YORK, NY / ACCESSWIRE / December 5, 2023 / Sidoti Events, LLC, an affiliate of Sidoti & Company, LLC, has released the presentation schedule and weblinks for its two-day December Small-Cap Conference taking place Wednesday and Thursday, December ... |
L.B. Foster to Present at Sidoti and Singular Conferences; Updated Corporate Investor Presentation to be Posted OnlinePITTSBURGH, Nov. 29, 2023 (GLOBE NEWSWIRE) -- L.B. Foster Company (NASDAQ: FSTR, the “Company”), announced today that John Kasel, President and Chief Executive Officer, and Bill Thalman, Executive Vice President and Chief Financial Officer, will present virtually at two upcoming investor conferences: the Sidoti Small-Cap Virtual Conference on December 6, 2023 beginning at 9:15 AM EST and the Singular Research Best of the Uncovered Conference on December 7, 2023 beginning at 11:30 AM EST. The Com |
L.B. Foster (FSTR) Q3 Earnings Miss Estimates, Revenues BeatL.B. Foster's (FSTR) Q3 performance was impacted by the exit of the bridge grid deck product line associated with long-term contract changes in the Steel Products and Measurement segment. |
L.B. Foster Company (NASDAQ:FSTR) Q3 2023 Earnings Call TranscriptL.B. Foster Company (NASDAQ:FSTR) Q3 2023 Earnings Call Transcript November 7, 2023 L.B. Foster Company misses on earnings expectations. Reported EPS is $0.05 EPS, expectations were $0.26. Operator: Good day, and welcome to L.B. Foster’s Third Quarter of 2023 Earnings Call. Later, we will conduct a question-and-answer session and instructions will be given at that […] |
FSTR Price Returns
| 1-mo | 8.93% |
| 3-mo | -4.74% |
| 6-mo | -1.81% |
| 1-year | 63.85% |
| 3-year | 31.34% |
| 5-year | -10.93% |
| YTD | 5.96% |
| 2023 | 127.17% |
| 2022 | -29.60% |
| 2021 | -8.64% |
| 2020 | -22.34% |
| 2019 | 21.89% |
Continue Researching FSTR
Want to see what other sources are saying about Foster L B Co's financials and stock price? Try the links below:Foster L B Co (FSTR) Stock Price | Nasdaq
Foster L B Co (FSTR) Stock Quote, History and News - Yahoo Finance
Foster L B Co (FSTR) Stock Price and Basic Information | MarketWatch
Loading social stream, please wait...