
FTC Solar, Inc. (FTCI): Price and Financial Metrics
FTCI Price/Volume Stats
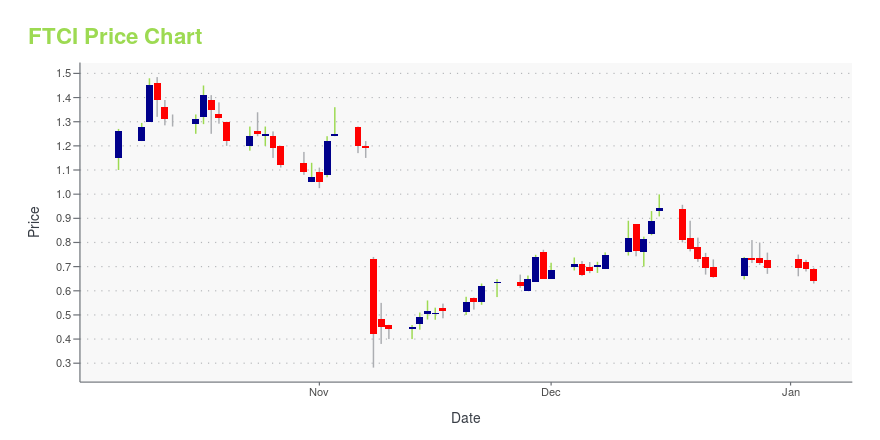
| Current price | $0.48 | 52-week high | $3.87 |
| Prev. close | $0.42 | 52-week low | $0.28 |
| Day low | $0.41 | Volume | 715,619 |
| Day high | $0.49 | Avg. volume | 684,763 |
| 50-day MA | $0.43 | Dividend yield | N/A |
| 200-day MA | $0.60 | Market Cap | 59.79M |
FTCI Stock Price Chart Interactive Chart >
FTC Solar, Inc. (FTCI) Company Bio
FTC Solar, Inc. provides solar tracker systems, and software and engineering services in the United States and internationally. The company markets its two-panel in-portrait single-axis tracker systems under the Voyager brand name. Its software solutions include SunPath, a solution to enhance energy production; SunDAT, an online 3D solar PV design solution; and Atlas, a solar portfolio management solution. The company serves customers through a sales and support network. Its customers include solar asset owners and project developers; and engineering, procurement, and construction contractors that design and build solar energy projects. The company was incorporated in 2017 and is headquartered in Austin, Texas.
Latest FTCI News From Around the Web
Below are the latest news stories about FTC SOLAR INC that investors may wish to consider to help them evaluate FTCI as an investment opportunity.
FTC Solar Appoints Anthony Carroll as Chairman of Newly Formed Customer Advisory BoardAUSTIN, Texas, Dec. 07, 2023 (GLOBE NEWSWIRE) -- FTC Solar, Inc. (Nasdaq: FTCI), a leading provider of solar tracker systems, software, and engineering services, announced today that it has formed a Customer Advisory Board to support growth and a world-class customer experience, and has named renewables expert Anthony Carroll as its inaugural Chairman. The advisory board will serve as a valuable resource to support company growth from pipeline development through purchase order. Consistent feedb |
Downgrade: Here's How Analysts See FTC Solar, Inc. (NASDAQ:FTCI) Performing In The Near TermToday is shaping up negative for FTC Solar, Inc. ( NASDAQ:FTCI ) shareholders, with the analysts delivering a... |
FTC Solar, Inc. (NASDAQ:FTCI) Q3 2023 Earnings Call TranscriptFTC Solar, Inc. (NASDAQ:FTCI) Q3 2023 Earnings Call Transcript November 8, 2023 FTC Solar, Inc. misses on earnings expectations. Reported EPS is $-0.08 EPS, expectations were $-0.06. Operator: Hello and welcome to FTC Solar Third Quarter 2023 Earnings Conference Call. At this time, all participants are in a listen-only mode. After the speaker’s presentation, there […] |
FTC Solar, Inc.'s (NASDAQ:FTCI) Intrinsic Value Is Potentially 25% Below Its Share PriceKey Insights Using the 2 Stage Free Cash Flow to Equity, FTC Solar fair value estimate is US$0.32 Current share price... |
FTC Solar Announces Third Quarter 2023 Financial Results and Leadership TransitionThird Quarter Highlights and Recent Developments Revenue of $30.5 million up 84% y/y, down 5.6% q/qContinue to improve cost structure, as evidenced by gross margin on sub-scale revenue levelsProject backlog of approximately $1.6 billion, with approximately $60 million added since August 9Leadership transition announced with Sean Hunkler and Phelps Morris departing AUSTIN, Texas, Nov. 08, 2023 (GLOBE NEWSWIRE) -- FTC Solar, Inc. (Nasdaq: FTCI), a leading provider of solar tracker systems, softwar |
FTCI Price Returns
| 1-mo | 19.97% |
| 3-mo | 11.91% |
| 6-mo | -15.79% |
| 1-year | -86.78% |
| 3-year | -95.15% |
| 5-year | N/A |
| YTD | -30.72% |
| 2023 | -74.15% |
| 2022 | -64.55% |
| 2021 | N/A |
| 2020 | N/A |
| 2019 | N/A |
Loading social stream, please wait...