fuboTV Inc. (FUBO): Price and Financial Metrics
GET POWR RATINGS... FREE!
FUBO POWR Grades
- FUBO scores best on the Value dimension, with a Value rank ahead of 46.22% of US stocks.
- FUBO's strongest trending metric is Value; it's been moving up over the last 179 days.
- FUBO's current lowest rank is in the Stability metric (where it is better than 1.79% of US stocks).
FUBO Stock Summary
- With a year-over-year growth in debt of 986.06%, fuboTV Inc's debt growth rate surpasses 98.46% of about US stocks.
- Revenue growth over the past 12 months for fuboTV Inc comes in at 193.16%, a number that bests 95.82% of the US stocks we're tracking.
- In terms of volatility of its share price, FUBO is more volatile than 94% of stocks we're observing.
- Stocks with similar financial metrics, market capitalization, and price volatility to fuboTV Inc are BMBL, TDOC, YEXT, RMO, and MARK.
- Visit FUBO's SEC page to see the company's official filings. To visit the company's web site, go to www.facebankgroup.com.
FUBO Valuation Summary
- In comparison to the median Consumer Cyclical stock, FUBO's price/sales ratio is 557.14% higher, now standing at 9.2.
- FUBO's price/earnings ratio has moved up 19.1 over the prior 22 months.
- Over the past 22 months, FUBO's price/sales ratio has gone NA NA.
Below are key valuation metrics over time for FUBO.
Stock | Date | P/S | P/B | P/E | EV/EBIT |
---|---|---|---|---|---|
FUBO | 2021-08-27 | 9.2 | 6.2 | -6.3 | -6.2 |
FUBO | 2021-08-26 | 8.9 | 6.0 | -6.1 | -6.0 |
FUBO | 2021-08-25 | 9.3 | 6.3 | -6.4 | -6.3 |
FUBO | 2021-08-24 | 9.4 | 6.4 | -6.5 | -6.3 |
FUBO | 2021-08-23 | 8.9 | 6.0 | -6.1 | -6.0 |
FUBO | 2021-08-20 | 8.6 | 5.8 | -5.9 | -5.8 |
FUBO's Quality Factors
The “Quality” component of the POWR Ratings focuses on 31 different factors of a companies fundamentals and operational strength. Here are some key insights as we drill into the specifics of these quality attributes.- FUBO has a Quality Grade of F, ranking ahead of 1.45% of graded US stocks.
- FUBO's asset turnover comes in at 0.417 -- ranking 19th of 44 Entertainment stocks.
- 500 - Internal server error
The table below shows FUBO's key quality metrics over time.
Period | Asset Turnover | Gross Margin | ROIC |
---|---|---|---|
2021-06-30 | 0.417 | -0.027 | 65.265 |
2021-03-31 | 0.333 | -0.083 | 5.971 |
2020-12-31 | 0.286 | -0.074 | 4.422 |
2020-09-30 | 0.180 | -0.155 | 5.003 |
2020-09-30 | 0.180 | -0.155 | 5.003 |
2020-06-30 | 0.109 | -0.123 | 3.537 |
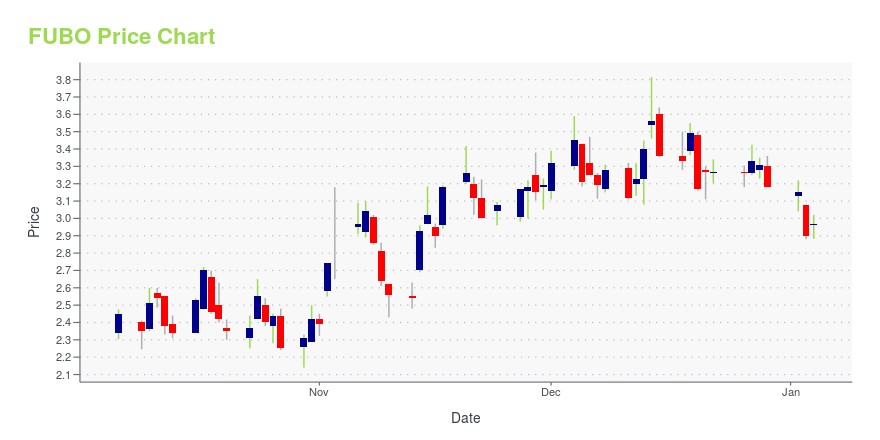
FUBO Stock Price Chart Interactive Chart >
FUBO Price/Volume Stats
Current price | $2.47 | 52-week high | $35.10 |
Prev. close | $2.58 | 52-week low | $2.34 |
Day low | $2.34 | Volume | 10,228,500 |
Day high | $2.55 | Avg. volume | 12,775,920 |
50-day MA | $3.36 | Dividend yield | N/A |
200-day MA | $13.26 | Market Cap | 457.15M |
fuboTV Inc. (FUBO) Company Bio
fuboTV, Inc. is a digital entertainment company. The company is focused on offering consumers a live television (TV) streaming platform for sports, news and entertainment through fuboTV. fuboTV is a virtual multichannel video programming distributor (vMVPD) that streams in 4K. Its subscription-based services are offered to consumers who can sign-up for accounts at https://fubo.tv, through which it provides basic plans with the flexibility for consumers to purchase the add-ons and features suited for them. The company was founded by David Gandler, Alberto Horihuela Suarez, and Sung Ho Choi on February 20, 2009 and is headquartered in New York, NY.
Latest FUBO News From Around the Web
Below are the latest news stories about fuboTV Inc that investors may wish to consider to help them evaluate FUBO as an investment opportunity.
FuboTV stock pares decline in regular action; Wedbush stays positiveFuboTV (NYSE:FUBO) has pulled a sharp turnaround Thursday from premarket and opening declines, after Wednesday's earnings report narrowly missed profit expectations on revenues that more than doubled. The stock was down some 18% premarket Thursday, but moved into positive ground 20 minutes after the market opened. It's currently back down... |
fuboTV Inc. 2021 Q4 - Results - Earnings Call PresentationThe following slide deck was published by fuboTV Inc. in conjunction with their 2021 Q4 earnings call.... |
FuboTV Slips 4.5% on Mixed Q4 ResultsAmerican sports-focused live TV streaming service fuboTV Inc. (FUBO) delivered mixed fourth-quarter results, beating revenue but missing earnings expectations. Following the news, shares slipped 4.5% during the extended trading session, continuing its downward spiral from the day trading when the stock lost 4.9% to close at $7.62 on February 23. Notably, fuboTV added 185,000 net subscribers in Q4 and ended the year with 1.13 million total paid subscribers. Further, fuboTV’s customers streamed 404 million hours of content during Q4, growing 96% compared to the same period last year. What’s more, FUBO’s total Average Revenue Per User (ARPU) per month grew 8% year-over-year to $74.52. |
Why fuboTV Stock Was Up TodayShares of fuboTV (NYSE: FUBO) initially fell 18% in after-hours trading on Wednesday before recovering. After digesting the company's recent earnings report, however, investors seemed to change their mind, with the share price up 2.6% as of noon ET on Thursday. Revenue came in above expectations, but the company reported a wider net loss than analysts anticipated. |
FuboTV’s Subscribers Hit a Record. The Stock Is Falling Anyway.The New York-based streaming platform said it closed out the year with a record 1.13 million total paid subscribers. |
FUBO Price Returns
1-mo | -21.34% |
3-mo | -62.29% |
6-mo | -84.09% |
1-year | -92.02% |
3-year | -69.88% |
5-year | N/A |
YTD | -84.09% |
2021 | -44.57% |
2020 | 214.43% |
2019 | 31.93% |
2018 | N/A |
2017 | 0.00% |
Loading social stream, please wait...