Golden Arrow Merger Corp. (GAMCU): Price and Financial Metrics
GAMCU Price/Volume Stats
| Current price | $8.78 | 52-week high | $15.69 |
| Prev. close | $12.40 | 52-week low | $8.78 |
| Day low | $8.78 | Volume | 17,000 |
| Day high | $15.69 | Avg. volume | 11,500 |
| 50-day MA | $0.00 | Dividend yield | N/A |
| 200-day MA | $0.00 | Market Cap | N/A |
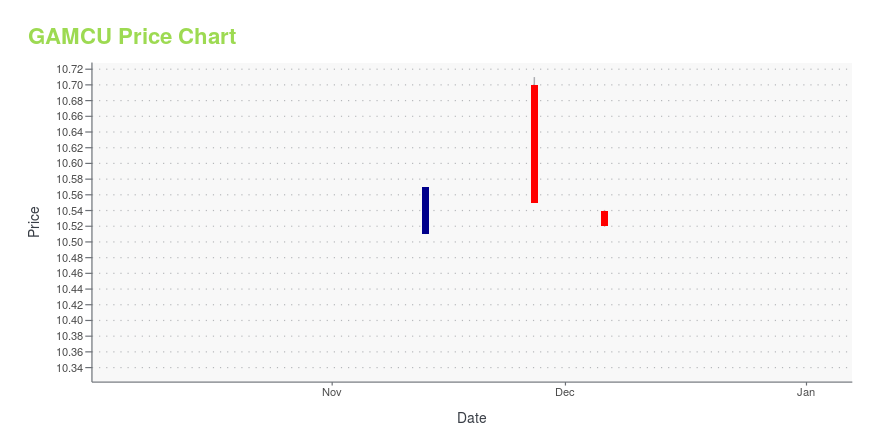
GAMCU Stock Price Chart Interactive Chart >
Golden Arrow Merger Corp. (GAMCU) Company Bio
Golden Arrow Merger Corp. intends to effect a merger, capital stock exchange, asset acquisition, stock purchase, reorganization, or similar business combination with one or more businesses in the healthcare or healthcare-related infrastructure industries in the United States and other developed countries. The company was incorporated in 2020 and is based in New York, New York.
GAMCU Price Returns
| 1-mo | N/A |
| 3-mo | N/A |
| 6-mo | N/A |
| 1-year | N/A |
| 3-year | N/A |
| 5-year | N/A |
| YTD | N/A |
| 2024 | N/A |
| 2023 | 0.00% |
| 2022 | N/A |
| 2021 | N/A |
| 2020 | N/A |


Loading social stream, please wait...