GAN Ltd. (GAN): Price and Financial Metrics
GET POWR RATINGS... FREE!
GAN POWR Grades
- GAN scores best on the Value dimension, with a Value rank ahead of 63.67% of US stocks.
- The strongest trend for GAN is in Momentum, which has been heading down over the past 179 days.
- GAN ranks lowest in Sentiment; there it ranks in the 1st percentile.
GAN Stock Summary
- The ratio of debt to operating expenses for GAN Ltd is higher than it is for about merely 0.5% of US stocks.
- With a year-over-year growth in debt of -100%, GAN Ltd's debt growth rate surpasses only 0% of about US stocks.
- In terms of twelve month growth in earnings before interest and taxes, GAN Ltd is reporting a growth rate of -898.91%; that's higher than merely 2.36% of US stocks.
- If you're looking for stocks that are quantitatively similar to GAN Ltd, a group of peers worth examining would be CASI, AMST, OM, SAIL, and UPWK.
- GAN's SEC filings can be seen here. And to visit GAN Ltd's official web site, go to www.gan.com.
GAN Valuation Summary
- In comparison to the median Consumer Cyclical stock, GAN's EV/EBIT ratio is 335.33% lower, now standing at -39.3.
- GAN's price/sales ratio has moved down 3.4 over the prior 16 months.
- GAN's price/earnings ratio has moved down 246 over the prior 16 months.
Below are key valuation metrics over time for GAN.
Stock | Date | P/S | P/B | P/E | EV/EBIT |
---|---|---|---|---|---|
GAN | 2021-08-27 | 9.0 | 2.9 | -38.6 | -39.3 |
GAN | 2021-08-26 | 8.7 | 2.8 | -37.3 | -37.8 |
GAN | 2021-08-25 | 8.7 | 2.8 | -37.4 | -37.9 |
GAN | 2021-08-24 | 8.7 | 2.8 | -37.3 | -37.8 |
GAN | 2021-08-23 | 8.3 | 2.7 | -35.3 | -35.7 |
GAN | 2021-08-20 | 7.8 | 2.5 | -33.5 | -33.7 |
GAN's Quality Factors
The “Quality” component of the POWR Ratings focuses on 31 different factors of a companies fundamentals and operational strength. Here are some key insights as we drill into the specifics of these quality attributes.- GAN has a Quality Grade of D, ranking ahead of 19.99% of graded US stocks.
- GAN's asset turnover comes in at 0.401 -- ranking 375th of 563 Business Services stocks.
- 500 - Internal server error
The table below shows GAN's key quality metrics over time.
Period | Asset Turnover | Gross Margin | ROIC |
---|---|---|---|
2021-06-30 | 0.401 | 0.705 | 6.083 |
2021-03-31 | 0.363 | 0.700 | 9.018 |
2020-12-31 | 0.396 | 0.702 | 46.115 |
2020-09-30 | 0.575 | 0.600 | 3.118 |
GAN Price Target
For more insight on analysts targets of GAN, see our GAN price target page. And for a list of of all stocks sorted by upside potential based on analyst target price, see our Top Price Target page.
Average Price Target | $24.00 | Average Broker Recommendation | 1.5 (Moderate Buy) |
GAN Stock Price Chart Interactive Chart >
GAN Price/Volume Stats
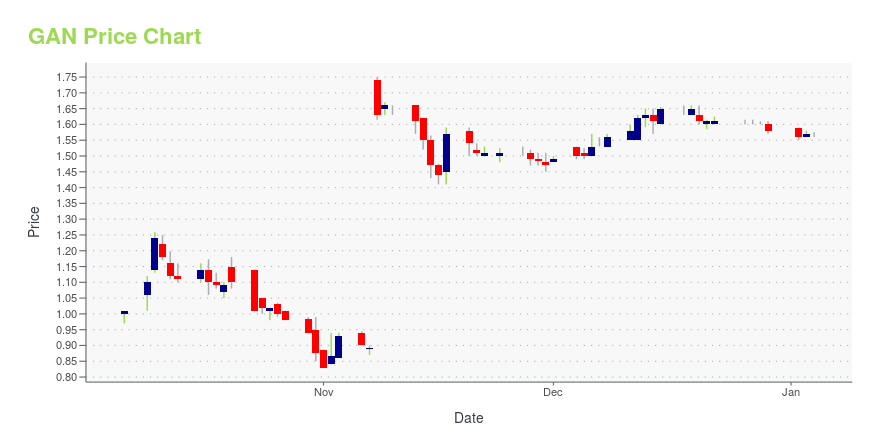
Current price | $3.24 | 52-week high | $18.19 |
Prev. close | $3.31 | 52-week low | $2.94 |
Day low | $3.21 | Volume | 351,900 |
Day high | $3.42 | Avg. volume | 607,090 |
50-day MA | $3.57 | Dividend yield | N/A |
200-day MA | $8.17 | Market Cap | 136.90M |
GAN Ltd. (GAN) Company Bio
GAN Ltd. engages in the provision of enterprise solutions for online casino gaming. It operates through the Real Money Gaming Operations and Simulated Gaming Operations segments. The Real Money Gaming Operations segment generates revenue from its customers' use of its platform and software. The Simulated Gaming Operations segment provides simulated gaming applications and associated services to its land-based casino clients. The company was founded on December 13, 2019 and is headquartered in London, the United Kingdom.
Latest GAN News From Around the Web
Below are the latest news stories about GAN Ltd that investors may wish to consider to help them evaluate GAN as an investment opportunity.
Square (SQ) Beats Q4 Earnings and Revenue EstimatesSquare (SQ) delivered earnings and revenue surprises of 42.11% and 2.43%, respectively, for the quarter ended December 2021. Do the numbers hold clues to what lies ahead for the stock? |
GAN Limited (NASDAQ: GAN) Has Succeeded In Generating Interest In 2022, The Stock Is Down -26.99% Year-To-DateGAN Limited (NASDAQ:GAN)s traded shares stood at 0.36 million during the last session, with the companys beta value hitting 2.01. At the close of trading, the stocks price was $6.71, to imply a decrease of -2.89% or -$0.2 in intraday trading. The GAN shares 52-week high remains $31.81, putting it -374.07% down since that peak GAN Limited (NASDAQ: GAN) Has Succeeded In Generating Interest In 2022, The Stock Is Down -26.99% Year-To-Date Read More » |
Shareholders in GAN (NASDAQ:GAN) are in the red if they invested a year agoAs every investor would know, you don't hit a homerun every time you swing. But it's not unreasonable to try to avoid... |
Samjo Capital LLC Buys RumbleON Inc, Iteris Inc, Thryv Holdings Inc, Sells GAN, Exagen Inc, ...Investment company Samjo Capital LLC (Current Portfolio) buys RumbleON Inc, Iteris Inc, Thryv Holdings Inc, Research Solutions Inc, sells GAN, Exagen Inc, Quotient Technology Inc, Nephros Inc during the 3-months ended 2021Q4, according to the most recent filings of the investment company, Samjo Capital LLC. |
Live Oak Private Wealth LLC Buys Bristol-Myers Squibb Co, Sprott Physical Platinum & ...Investment company Live Oak Private Wealth LLC (Current Portfolio) buys Bristol-Myers Squibb Co, Sprott Physical Platinum & Palladium Tr, Nike Inc, Weyerhaeuser Co, Alibaba Group Holding, sells Invesco BulletShares 2021 Corporate Bond ETF, GAN, Sprott Physical Silver Trust, Truist Financial Corp, Norfolk Southern Corp during the 3-months ended 2021Q4, according to the most recent filings of the investment company, Live Oak Private Wealth LLC. |
GAN Price Returns
1-mo | -3.28% |
3-mo | -36.35% |
6-mo | -64.55% |
1-year | -81.03% |
3-year | N/A |
5-year | N/A |
YTD | -64.74% |
2021 | -54.68% |
2020 | N/A |
2019 | N/A |
2018 | N/A |
2017 | N/A |
Loading social stream, please wait...