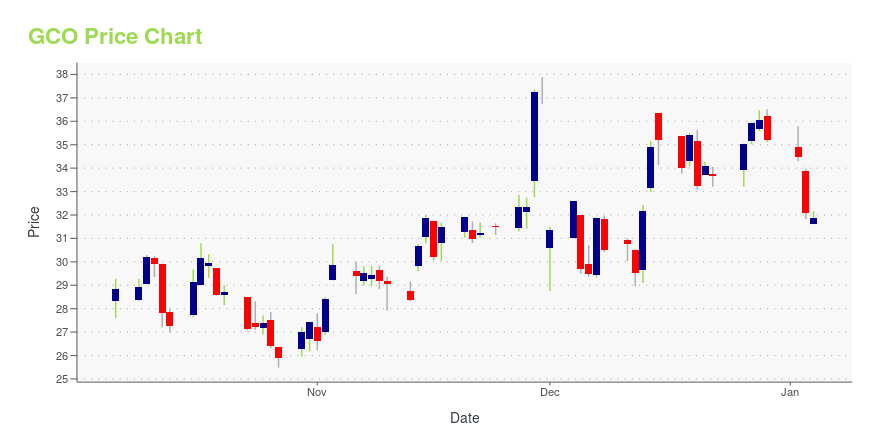
Genesco Inc. (GCO): Price and Financial Metrics
GCO Price/Volume Stats
| Current price | $30.08 | 52-week high | $37.89 |
| Prev. close | $29.15 | 52-week low | $23.21 |
| Day low | $29.13 | Volume | 93,045 |
| Day high | $30.24 | Avg. volume | 132,430 |
| 50-day MA | $26.42 | Dividend yield | N/A |
| 200-day MA | $28.41 | Market Cap | 349.71M |
GCO Stock Price Chart Interactive Chart >
Genesco Inc. (GCO) Company Bio
Genesco Inc. engages in the retail and wholesale of footwear, apparel, and accessories. The company operates in five segments: Journeys Group, Schuh Group, Lids Sports Group, Johnston & Murphy Group, and Licensed Brands. The company was founded in 1924 and is based in Nashville, Tennessee.
Latest GCO News From Around the Web
Below are the latest news stories about GENESCO INC that investors may wish to consider to help them evaluate GCO as an investment opportunity.
Calculating The Fair Value Of Genesco Inc. (NYSE:GCO)Key Insights Genesco's estimated fair value is US$35.66 based on 2 Stage Free Cash Flow to Equity With US$31.88 share... |
Genesco Inc. (NYSE:GCO) Q3 2024 Earnings Call TranscriptGenesco Inc. (NYSE:GCO) Q3 2024 Earnings Call Transcript December 1, 2023 Genesco Inc. misses on earnings expectations. Reported EPS is $0.57 EPS, expectations were $0.84. Operator: Good day, everyone, and welcome to Genesco’s Third Quarter Fiscal 2024 Conference Call. Just a reminder, today’s call is being recorded. I will now turn the call over to […] |
Q3 2024 Genesco Inc Earnings CallQ3 2024 Genesco Inc Earnings Call |
Why Genesco (GCO) Shares Are Plunging TodayShares of footwear, apparel, and accessories retailer Genesco (NYSE:GCO) fell 12.2% in the morning session after the company reported third quarter results with same-store sales, revenue, and EPS all falling below Wall Street's expectations. Management blamed "a challenging operating environment" and a delayed ERP system implementation internally for the weakness. Consumer demand remains "choppy" and Genesco plans to increase promotions to bring in shoppers, which will likely lead to weaker gros |
Genesco Expects Increased Holiday Promotional Activity at Journeys After Mixed Q3The Nashville-based footwear company reported net sales of $579 million in the third quarter, a decrease of 4 percent from $604 million the year prior. |
GCO Price Returns
| 1-mo | 20.13% |
| 3-mo | 14.81% |
| 6-mo | 4.59% |
| 1-year | 10.91% |
| 3-year | -47.71% |
| 5-year | -25.02% |
| YTD | -14.57% |
| 2023 | -23.49% |
| 2022 | -28.28% |
| 2021 | 113.26% |
| 2020 | -37.21% |
| 2019 | 8.17% |
Continue Researching GCO
Here are a few links from around the web to help you further your research on Genesco Inc's stock as an investment opportunity:Genesco Inc (GCO) Stock Price | Nasdaq
Genesco Inc (GCO) Stock Quote, History and News - Yahoo Finance
Genesco Inc (GCO) Stock Price and Basic Information | MarketWatch


Loading social stream, please wait...