Guess?, Inc. (GES): Price and Financial Metrics
GES Price/Volume Stats
Current price | $20.69 | 52-week high | $24.84 |
Prev. close | $20.99 | 52-week low | $14.51 |
Day low | $20.38 | Volume | 1,043,900 |
Day high | $21.07 | Avg. volume | 893,553 |
50-day MA | $21.55 | Dividend yield | 5.64% |
200-day MA | $20.59 | Market Cap | 1.11B |
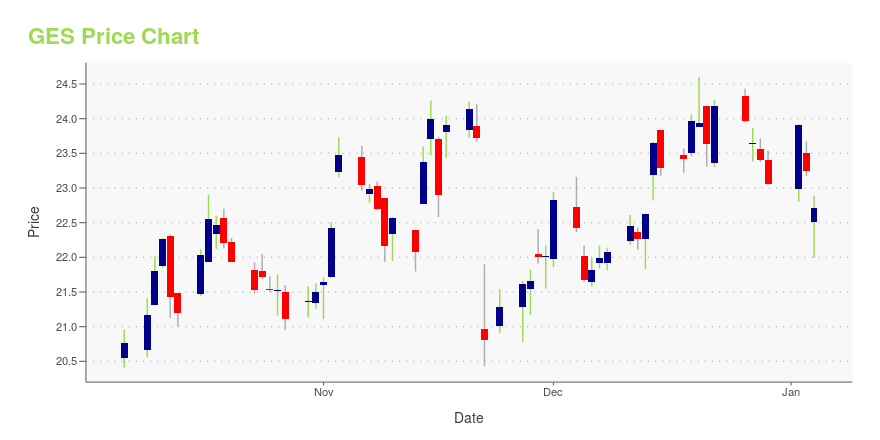
GES Stock Price Chart Interactive Chart >
GES POWR Grades
- GES scores best on the Growth dimension, with a Growth rank ahead of 93.39% of US stocks.
- GES's strongest trending metric is Growth; it's been moving up over the last 177 days.
- GES ranks lowest in Stability; there it ranks in the 11th percentile.
GES Stock Summary
- The capital turnover (annual revenue relative to shareholder's equity) for GES is 5.49 -- better than 91.92% of US stocks.
- Of note is the ratio of GUESS INC's sales and general administrative expense to its total operating expenses; 85.24% of US stocks have a lower such ratio.
- With a price/sales ratio of 0.43, GUESS INC has a higher such ratio than merely 15.53% of stocks in our set.
- Stocks that are quantitatively similar to GES, based on their financial statements, market capitalization, and price volatility, are CNM, STCN, SIG, CHEF, and NMRK.
- Visit GES's SEC page to see the company's official filings. To visit the company's web site, go to www.guess.com.
GES Valuation Summary
- GES's price/sales ratio is 0.5; this is 73.68% lower than that of the median Consumer Cyclical stock.
- Over the past 243 months, GES's price/earnings ratio has gone up 39.
Below are key valuation metrics over time for GES.
Stock | Date | P/S | P/B | P/E | EV/EBIT |
---|---|---|---|---|---|
GES | 2023-09-13 | 0.5 | 2.5 | 8.4 | 11.4 |
GES | 2023-09-12 | 0.5 | 2.5 | 8.6 | 11.6 |
GES | 2023-09-11 | 0.5 | 2.5 | 8.4 | 11.5 |
GES | 2023-09-08 | 0.5 | 2.5 | 8.5 | 11.6 |
GES | 2023-09-07 | 0.5 | 2.6 | 8.7 | 11.7 |
GES | 2023-09-06 | 0.5 | 2.6 | 8.7 | 11.7 |
GES Growth Metrics
- Its year over year price growth rate is now at -26.76%.
- Its 2 year net income to common stockholders growth rate is now at 515.03%.
- Its year over year cash and equivalents growth rate is now at -62.59%.

The table below shows GES's growth in key financial areas (numbers in millions of US dollars).
Date | Revenue | Operating Cash Flow | Net Income to Common Stock |
---|---|---|---|
2022-09-30 | 2,669.501 | 105.643 | 122.182 |
2022-06-30 | 2,679.168 | 90.168 | 130.227 |
2022-03-31 | 2,665.102 | 130.715 | 167.327 |
2021-12-31 | 2,591.631 | 131.642 | 171.363 |
2021-09-30 | 2,440.151 | 115.28 | 173.367 |
2021-06-30 | 2,366.365 | 211.341 | 169.863 |
GES's Quality Factors
The “Quality” component of the POWR Ratings focuses on 31 different factors of a companies fundamentals and operational strength. Here are some key insights as we drill into the specifics of these quality attributes.- GES has a Quality Grade of C, ranking ahead of 70.48% of graded US stocks.
- GES's asset turnover comes in at 0.978 -- ranking 18th of 32 Apparel stocks.
- OXM, RL, and DECK are the stocks whose asset turnover ratios are most correlated with GES.
The table below shows GES's key quality metrics over time.
Period | Asset Turnover | Gross Margin | ROIC |
---|---|---|---|
2021-07-31 | 0.978 | 0.432 | 0.093 |
2021-05-01 | 0.896 | 0.409 | 0.055 |
2021-01-30 | 0.790 | 0.371 | -0.026 |
2020-10-31 | 0.875 | 0.367 | -0.021 |
2020-08-01 | 0.893 | 0.354 | -0.026 |
2020-05-02 | 1.004 | 0.361 | -0.008 |
GES Price Target
For more insight on analysts targets of GES, see our GES price target page. And for a list of of all stocks sorted by upside potential based on analyst target price, see our Top Price Target page.
Average Price Target | $35.25 | Average Broker Recommendation | 1.62 (Moderate Buy) |
Guess?, Inc. (GES) Company Bio
Guess Inc. designs, markets, distributes and licenses a lifestyle collection of contemporary apparel, denim, handbags, watches, footwear and other related consumer products. The company was founded in 1981 and is based in Los Angeles, California.
Latest GES News From Around the Web
Below are the latest news stories about GUESS INC that investors may wish to consider to help them evaluate GES as an investment opportunity.
Guess?, Inc. Announces Retirement of Maurice Marciano from Board of DirectorsLOS ANGELES, September 29, 2023--Guess?, Inc. (NYSE: GES) today announced that Maurice Marciano is retiring from the Company’s Board of Directors effective immediately. |
Can Guess (GES) Climb 25.4% to Reach the Level Wall Street Analysts Expect?The consensus price target hints at a 25.4% upside potential for Guess (GES). While empirical research shows that this sought-after metric is hardly effective, an upward trend in earnings estimate revisions could mean that the stock will witness an upside in the near term. |
Reasons Why Guess? (GES) Should be in Your Portfolio NowGuess? (GES) gains from its business strength, solid omnichannel capabilities and customer-centric initiatives. Its growing online business also remains a tailwind. |
Hyatt (H) Focuses on Strategic Expansion Across AmericasStrategic expansion initiatives benefit Hyatt's (H) luxury and lifestyle brands' growth across Americas. |
Why You Must Add Strategic Education (STRA) Stock to PortfolioStrategic Education's (STRA) growth is attributable to solid enrollment, thanks to the strong demand environment, along with pricing and innovation strategies. |
GES Price Returns
1-mo | N/A |
3-mo | 8.42% |
6-mo | N/A |
1-year | 36.79% |
3-year | 81.50% |
5-year | 13.77% |
YTD | 4.12% |
2022 | -8.51% |
2021 | 7.00% |
2020 | 2.58% |
2019 | 11.18% |
2018 | 28.22% |
GES Dividends
Ex-Dividend Date | Type | Payout Amount | Change | ||||||
---|---|---|---|---|---|---|---|---|---|
Loading, please wait... |
Continue Researching GES
Here are a few links from around the web to help you further your research on Guess Inc's stock as an investment opportunity:Guess Inc (GES) Stock Price | Nasdaq
Guess Inc (GES) Stock Quote, History and News - Yahoo Finance
Guess Inc (GES) Stock Price and Basic Information | MarketWatch
Loading social stream, please wait...