Graham Holdings Company (GHC): Price and Financial Metrics
GET POWR RATINGS... FREE!
GHC POWR Grades
- GHC scores best on the Stability dimension, with a Stability rank ahead of 76.86% of US stocks.
- GHC's strongest trending metric is Growth; it's been moving down over the last 179 days.
- GHC ranks lowest in Quality; there it ranks in the 31st percentile.
GHC Stock Summary
- GRAHAM HOLDINGS CO's stock had its IPO on January 24, 1990, making it an older stock than 89.4% of US equities in our set.
- GHC's current price/earnings ratio is 40.69, which is higher than 85.01% of US stocks with positive earnings.
- In terms of volatility of its share price, GHC is more volatile than just 9.63% of stocks we're observing.
- If you're looking for stocks that are quantitatively similar to GRAHAM HOLDINGS CO, a group of peers worth examining would be AAME, NWSA, UNF, MHK, and XELB.
- GHC's SEC filings can be seen here. And to visit GRAHAM HOLDINGS CO's official web site, go to www.ghco.com.
GHC Valuation Summary
- GHC's EV/EBIT ratio is 23.7; this is 19.1% higher than that of the median Consumer Defensive stock.
- GHC's price/earnings ratio has moved down 1.2 over the prior 243 months.
Below are key valuation metrics over time for GHC.
Stock | Date | P/S | P/B | P/E | EV/EBIT |
---|---|---|---|---|---|
GHC | 2023-02-24 | 0.8 | 0.8 | 46.1 | 23.7 |
GHC | 2023-02-23 | 0.8 | 0.7 | 21.6 | 17.4 |
GHC | 2023-02-22 | 0.8 | 0.7 | 21.7 | 17.4 |
GHC | 2023-02-21 | 0.9 | 0.7 | 21.9 | 17.6 |
GHC | 2023-02-17 | 0.9 | 0.8 | 22.1 | 17.7 |
GHC | 2023-02-16 | 0.9 | 0.7 | 21.9 | 17.6 |
GHC Growth Metrics
- Its 5 year revenue growth rate is now at 20.68%.
- Its 3 year net income to common stockholders growth rate is now at 8.12%.
- Its 2 year net cashflow from operations growth rate is now at 3.63%.

The table below shows GHC's growth in key financial areas (numbers in millions of US dollars).
Date | Revenue | Operating Cash Flow | Net Income to Common Stock |
---|---|---|---|
2022-12-31 | 3,924.493 | 235.604 | 67.079 |
2022-09-30 | 3,723.392 | 208.82 | 145.6 |
2022-06-30 | 3,520.39 | 228.989 | 152.406 |
2022-03-31 | 3,388.24 | 223.319 | 335.249 |
2021-12-31 | 3,185.974 | 202.426 | 352.075 |
2021-09-30 | 3,110.054 | 167.044 | 504.535 |
GHC's Quality Factors
The “Quality” component of the POWR Ratings focuses on 31 different factors of a companies fundamentals and operational strength. Here are some key insights as we drill into the specifics of these quality attributes.- GHC has a Quality Grade of C, ranking ahead of 32.86% of graded US stocks.
- GHC's asset turnover comes in at 0.474 -- ranking 33rd of 50 Personal Services stocks.
- BFAM, UNF, and EDU are the stocks whose asset turnover ratios are most correlated with GHC.
The table below shows GHC's key quality metrics over time.
Period | Asset Turnover | Gross Margin | ROIC |
---|---|---|---|
2021-09-30 | 0.474 | 0.342 | 0.158 |
2021-06-30 | 0.476 | 0.345 | 0.182 |
2021-03-31 | 0.469 | 0.346 | 0.165 |
2020-12-31 | 0.490 | 0.338 | 0.113 |
2020-09-30 | 0.497 | 0.325 | 0.078 |
2020-06-30 | 0.508 | 0.317 | 0.066 |
GHC Price Target
For more insight on analysts targets of GHC, see our GHC price target page. And for a list of of all stocks sorted by upside potential based on analyst target price, see our Top Price Target page.
Average Price Target | $730.00 | Average Broker Recommendation | 1.5 (Moderate Buy) |
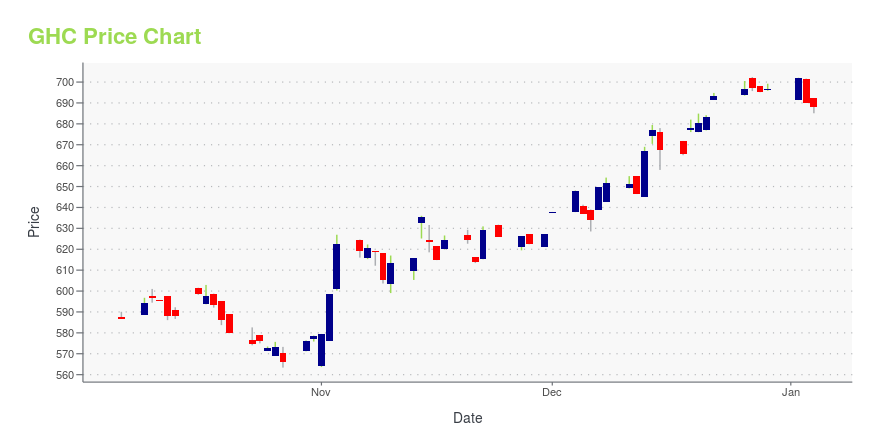
GHC Stock Price Chart Interactive Chart >
GHC Price/Volume Stats
Current price | $567.50 | 52-week high | $681.70 |
Prev. close | $569.66 | 52-week low | $525.58 |
Day low | $564.67 | Volume | 15,300 |
Day high | $570.85 | Avg. volume | 16,848 |
50-day MA | $626.71 | Dividend yield | 1.16% |
200-day MA | $598.28 | Market Cap | 2.72B |
Graham Holdings Company (GHC) Company Bio
Graham Holdings is a diversified education and media company whose principal operations include educational services, television broadcasting, cable systems and online services, print and local television news. Its education services operates in three segments: Kaplan Higher Education, Kaplan Test Preparation and Kaplan International. The company was founded in 1947 and is based in Washington, D.C.
Latest GHC News From Around the Web
Below are the latest news stories about GRAHAM HOLDINGS CO that investors may wish to consider to help them evaluate GHC as an investment opportunity.
Junior Achievement Announces Kaplan Partnership to Help High School Students Secure Their Post-Graduation GoalsNEW YORK, March 23, 2023--Global educational services provider Kaplan partners with Junior Achievement to prepare JA students for college and the world of work. |
Don Graham Transitions to Chairman Emeritus; Anne Mulcahy Elected Chair of the Board of Graham Holdings CompanyARLINGTON, Va., March 23, 2023--Graham Holdings Company (NYSE: GHC) announced today that Donald E. Graham has decided to transition from his role as Chairman of the Board of Directors. Mr. Graham will remain a member of the Board as Chairman Emeritus. Long-time board member Anne Mulcahy has been elected by the Board to serve as Chair effective May 2023. |
Is it a Smart Move to Invest in Graham Holdings Company (GHC)?Heartland Advisors, an investment management company, released its “Heartland Mid Cap Value Fund” fourth quarter 2022 investor letter. A copy of the same can be downloaded here. In the fourth quarter, the strategy returned a 12.38% (Net of Advisory Fees) compared to a 10.45% gain for the Russell Midcap Value Index. The stock selection in […] |
Why Graham Holdings Company (NYSE:GHC) Could Be Worth WatchingGraham Holdings Company ( NYSE:GHC ), is not the largest company out there, but it received a lot of attention from a... |
HelloFresh Partners with Kaplan to Provide Free GED® Prep for Hourly Workers to Earn High School Equivalency DiplomaNEW YORK, March 15, 2023--HelloFresh has partnered with global educational services provider Kaplan to offer free GED courses for all HelloFresh hourly workers. |
GHC Price Returns
1-mo | -13.61% |
3-mo | -4.76% |
6-mo | 6.57% |
1-year | -5.31% |
3-year | 90.48% |
5-year | 2.61% |
YTD | -5.84% |
2022 | -3.02% |
2021 | 19.25% |
2020 | -15.32% |
2019 | 0.57% |
2018 | 15.78% |
GHC Dividends
Ex-Dividend Date | Type | Payout Amount | Change | ||||||
---|---|---|---|---|---|---|---|---|---|
Loading, please wait... |
Continue Researching GHC
Want to see what other sources are saying about Graham Holdings Co's financials and stock price? Try the links below:Graham Holdings Co (GHC) Stock Price | Nasdaq
Graham Holdings Co (GHC) Stock Quote, History and News - Yahoo Finance
Graham Holdings Co (GHC) Stock Price and Basic Information | MarketWatch
Loading social stream, please wait...