
Global Net Lease, Inc. (GNL): Price and Financial Metrics
GNL Price/Volume Stats
| Current price | $8.96 | 52-week high | $11.58 |
| Prev. close | $8.73 | 52-week low | $6.52 |
| Day low | $8.79 | Volume | 1,099,300 |
| Day high | $8.98 | Avg. volume | 1,547,244 |
| 50-day MA | $7.66 | Dividend yield | 12.51% |
| 200-day MA | $8.05 | Market Cap | 2.06B |
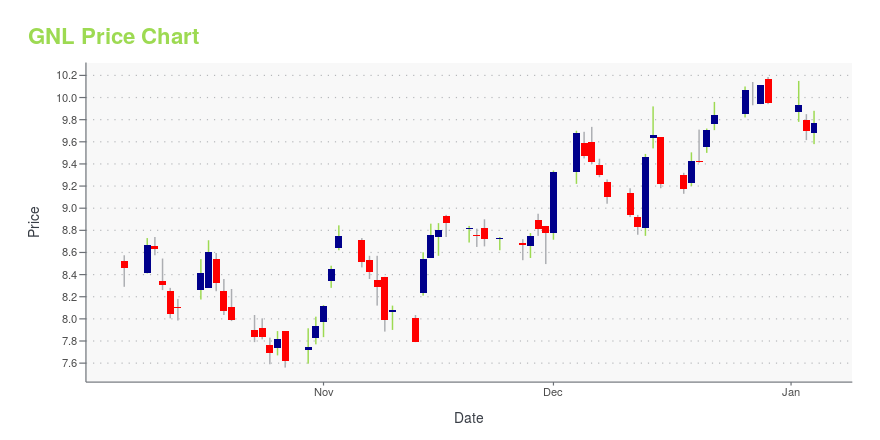
GNL Stock Price Chart Interactive Chart >
Global Net Lease, Inc. (GNL) Company Bio
Global Net Lease, Inc. invests in the real estate markets across the globe. It focuses on acquiring and managing a globally-diversified portfolio of strategically-located commercial real estate properties. The firm was formerly known as American Realty Capital Global Trust, Inc. The company was founded in 2011 and is based in New York City, New York.
Latest GNL News From Around the Web
Below are the latest news stories about GLOBAL NET LEASE INC that investors may wish to consider to help them evaluate GNL as an investment opportunity.
Global Net Lease, Inc. Announces Preferred Stock DividendsNEW YORK, Dec. 21, 2023 (GLOBE NEWSWIRE) -- Global Net Lease, Inc. (“GNL” or the “Company”) (NYSE: GNL/ GNL PRA / GNL PRB / GNL PRD / GNL PRE) announced today that it declared quarterly dividends on its outstanding preferred stock. Specifically, GNL declared (i) a dividend of $0.453125 per share on its 7.25% Series A Cumulative Redeemable Preferred Stock (“Series A Preferred Stock”), payable on January 16, 2024, to holders of record of shares of its Series A Preferred Stock at the close of busin |
Global Net Lease Continues Leasing Momentum Into the Fourth QuarterNEW YORK, Dec. 04, 2023 (GLOBE NEWSWIRE) -- Global Net Lease, Inc. (NYSE: GNL) (“GNL” or the “Company”) announced today that it completed approximately 1.7 million square feet of leasing activity, comprised of over 313,000 square feet of multi-tenant assets and nearly 1.4 million square feet of single-tenant assets since September 30, 2023. Within the multi-tenant segment, the Company signed four new leases totaling nearly 82,000 square feet, that will generate over $1.2 million in annualized st |
Global Net Lease, Inc. (NYSE:GNL) Q3 2023 Earnings Call TranscriptGlobal Net Lease, Inc. (NYSE:GNL) Q3 2023 Earnings Call Transcript November 8, 2023 Operator: Good afternoon, and welcome to the Global Net Lease Third Quarter 2023 Earnings Conference Call. [Operator Instructions]. Please note, this event is being recorded. I would now like to turn the conference over to Jordyn Schoenfeld, Associate at Global Net Lease. […] |
Q3 2023 Global Net Lease Inc Earnings CallQ3 2023 Global Net Lease Inc Earnings Call |
Global Net Lease Reports Third Quarter 2023 ResultsClosed Transformational Merger and Internalization Creating Third Largest Publicly Listed Net Lease REIT with a Global PresenceExceeded Initial Synergy Estimate of $54 Million by $2 Million Based on 19 days of Lower Than Expected G&A Expenses1Third Quarter Results Reflect Only 19 Days of Results Post Completion of the Merger and Internalization Leased Over 1.8 Million Square Feet in the Third Quarter, $17 Million of Net New Straight-Line Rent Continued Leasing Momentum with a Renewal Spread of 5 |
GNL Price Returns
| 1-mo | 29.32% |
| 3-mo | 34.55% |
| 6-mo | 8.62% |
| 1-year | -3.44% |
| 3-year | -28.09% |
| 5-year | -16.46% |
| YTD | 0.51% |
| 2023 | -8.95% |
| 2022 | -7.46% |
| 2021 | -2.35% |
| 2020 | -6.06% |
| 2019 | 26.15% |
GNL Dividends
| Ex-Dividend Date | Type | Payout Amount | Change | ||||||
|---|---|---|---|---|---|---|---|---|---|
| Loading, please wait... | |||||||||
Continue Researching GNL
Want to see what other sources are saying about Global Net Lease Inc's financials and stock price? Try the links below:Global Net Lease Inc (GNL) Stock Price | Nasdaq
Global Net Lease Inc (GNL) Stock Quote, History and News - Yahoo Finance
Global Net Lease Inc (GNL) Stock Price and Basic Information | MarketWatch
Loading social stream, please wait...