Genworth Financial Inc (GNW): Price and Financial Metrics
GNW Price/Volume Stats
Current price | $6.03 | 52-week high | $6.40 |
Prev. close | $5.89 | 52-week low | $4.51 |
Day low | $5.83 | Volume | 2,606,000 |
Day high | $6.09 | Avg. volume | 3,239,856 |
50-day MA | $5.90 | Dividend yield | N/A |
200-day MA | $5.68 | Market Cap | 2.72B |
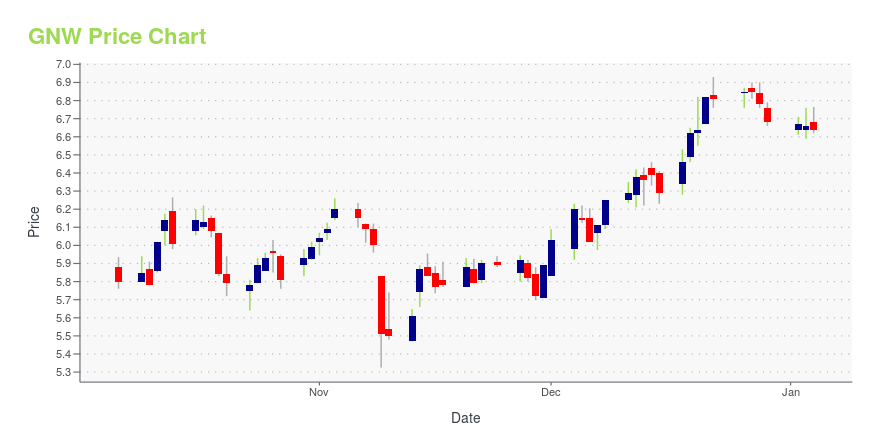
GNW Stock Price Chart Interactive Chart >
GNW POWR Grades
- GNW scores best on the Momentum dimension, with a Momentum rank ahead of 96.38% of US stocks.
- The strongest trend for GNW is in Stability, which has been heading up over the past 177 days.
- GNW ranks lowest in Sentiment; there it ranks in the 15th percentile.
GNW Stock Summary
- With a price/earnings ratio of 6.16, GENWORTH FINANCIAL INC P/E ratio is greater than that of about merely 10.3% of stocks in our set with positive earnings.
- The price/operating cash flow metric for GENWORTH FINANCIAL INC is higher than just 11.34% of stocks in our set with a positive cash flow.
- Equity multiplier, or assets relative to shareholders' equity, comes in at 10.72 for GENWORTH FINANCIAL INC; that's greater than it is for 91.23% of US stocks.
- Stocks that are quantitatively similar to GNW, based on their financial statements, market capitalization, and price volatility, are CFB, VLY, BSVN, CBNK, and HTLF.
- Visit GNW's SEC page to see the company's official filings. To visit the company's web site, go to www.genworth.com.
GNW Valuation Summary
- GNW's price/sales ratio is 0.3; this is 70% lower than that of the median Financial Services stock.
- Over the past 237 months, GNW's price/earnings ratio has gone down 3.1.
Below are key valuation metrics over time for GNW.
Stock | Date | P/S | P/B | P/E | EV/EBIT |
---|---|---|---|---|---|
GNW | 2023-11-10 | 0.3 | 0.3 | 6.2 | 3.0 |
GNW | 2023-11-09 | 0.3 | 0.3 | 6.2 | 3.0 |
GNW | 2023-11-08 | 0.4 | 0.4 | 5.8 | 2.8 |
GNW | 2023-11-07 | 0.4 | 0.4 | 5.9 | 2.8 |
GNW | 2023-11-06 | 0.4 | 0.4 | 6.0 | 2.9 |
GNW | 2023-11-03 | 0.4 | 0.4 | 6.0 | 2.9 |
GNW Growth Metrics
- The 5 year price growth rate now stands at -21.52%.
- Its 5 year revenue growth rate is now at -8.04%.
- Its year over year net income to common stockholders growth rate is now at 100.93%.

The table below shows GNW's growth in key financial areas (numbers in millions of US dollars).
Date | Revenue | Operating Cash Flow | Net Income to Common Stock |
---|---|---|---|
2022-09-30 | 7,348 | 792 | 597 |
2022-06-30 | 7,579 | 545 | 807 |
2022-03-31 | 7,739 | 592 | 866 |
2021-12-31 | 7,832 | 437 | 904 |
2021-09-30 | 8,359 | 798 | 1,008 |
2021-06-30 | 8,709 | 890 | 1,112 |
GNW's Quality Factors
The “Quality” component of the POWR Ratings focuses on 31 different factors of a companies fundamentals and operational strength. Here are some key insights as we drill into the specifics of these quality attributes.- GNW has a Quality Grade of C, ranking ahead of 30.27% of graded US stocks.
- GNW's asset turnover comes in at 0.085 -- ranking 112th of 133 Insurance stocks.
- MKL, CINF, and WTM are the stocks whose asset turnover ratios are most correlated with GNW.
The table below shows GNW's key quality metrics over time.
Period | Asset Turnover | Gross Margin | ROIC |
---|---|---|---|
2021-06-30 | 0.085 | 0.374 | 0.016 |
2021-03-31 | 0.085 | 0.343 | 0.009 |
2020-12-31 | 0.084 | 0.314 | 0.006 |
2020-09-30 | 0.083 | 0.283 | 0.003 |
2020-06-30 | 0.078 | 0.248 | -0.002 |
2020-03-31 | 0.079 | 0.276 | 0.005 |
GNW Price Target
For more insight on analysts targets of GNW, see our GNW price target page. And for a list of of all stocks sorted by upside potential based on analyst target price, see our Top Price Target page.
Average Price Target | $2.50 | Average Broker Recommendation | 2 (Hold) |
Genworth Financial Inc (GNW) Company Bio
Genworth Financial provides insurance, retirement, and homeownership solutions in the United States and internationally. It operates through U.S. Life Insurance, International Mortgage Insurance, U.S. Mortgage Insurance, International Protection, and Runoff segments. The company was founded in 2003 and is based in Richmond, Virginia.
Latest GNW News From Around the Web
Below are the latest news stories about GENWORTH FINANCIAL INC that investors may wish to consider to help them evaluate GNW as an investment opportunity.
Genworth Financial, Inc. (NYSE:GNW) Q3 2023 Earnings Call TranscriptGenworth Financial, Inc. (NYSE:GNW) Q3 2023 Earnings Call Transcript November 9, 2023 Genworth Financial, Inc. misses on earnings expectations. Reported EPS is $0.06 EPS, expectations were $0.22. Operator: Good morning, ladies and gentlemen, and welcome to Genworth’s Financial Third Quarter 2023 Earnings Conference Call. My name is Lisa, and I will be your coordinator today. […] |
Q3 2023 Genworth Financial Inc Earnings CallQ3 2023 Genworth Financial Inc Earnings Call |
Genworth Financial (GNW) Q3 2023 Earnings Call TranscriptThe slide presentation that accompanies this call is available on the investor relations section of the Genworth's website, investor.genworth.com. Speaking today will be Tom McInerney, president and chief executive officer; and Jerome Upton, chief financial officer. |
Genworth Financial Inc (GNW) Reports Mixed Third Quarter 2023 ResultsNet Income Declines While Adjusted Operating Income Shows Resilience Amidst Market Volatility |
Genworth Financial Announces Third Quarter 2023 ResultsRICHMOND, Va., November 08, 2023--Genworth Financial, Inc. (NYSE: GNW) today reported results for the quarter ended September 30, 2023. |
GNW Price Returns
1-mo | -2.74% |
3-mo | 9.64% |
6-mo | 3.43% |
1-year | 17.32% |
3-year | 26.68% |
5-year | N/A |
YTD | 13.99% |
2022 | 30.62% |
2021 | 7.14% |
2020 | -14.09% |
2019 | -5.58% |
2018 | 49.84% |
Continue Researching GNW
Want to do more research on Genworth Financial Inc's stock and its price? Try the links below:Genworth Financial Inc (GNW) Stock Price | Nasdaq
Genworth Financial Inc (GNW) Stock Quote, History and News - Yahoo Finance
Genworth Financial Inc (GNW) Stock Price and Basic Information | MarketWatch
Loading social stream, please wait...