
Globalstar, Inc. (GSAT): Price and Financial Metrics
GSAT Price/Volume Stats
| Current price | $1.25 | 52-week high | $2.13 |
| Prev. close | $1.23 | 52-week low | $1.01 |
| Day low | $1.20 | Volume | 2,407,608 |
| Day high | $1.26 | Avg. volume | 3,915,339 |
| 50-day MA | $1.16 | Dividend yield | N/A |
| 200-day MA | $1.41 | Market Cap | 2.38B |
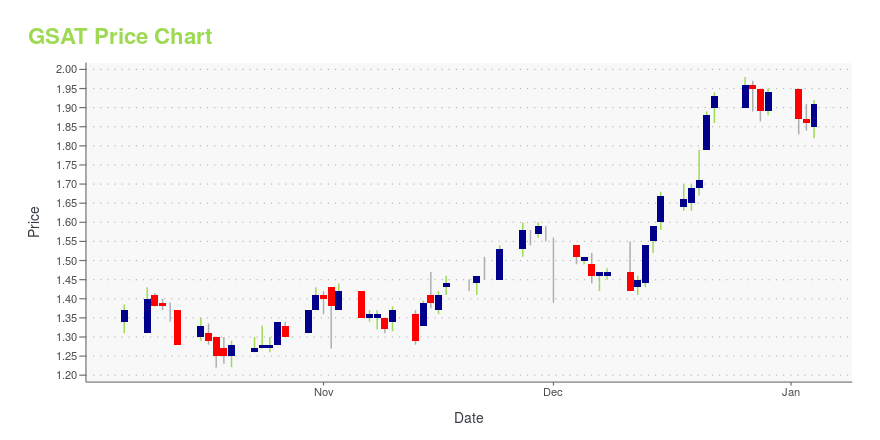
GSAT Stock Price Chart Interactive Chart >
Globalstar, Inc. (GSAT) Company Bio
Globalstar, Inc. provides mobile voice and data communications services through satellite worldwide. The company was founded in 2003 and is based in Covington, Louisiana.
Latest GSAT News From Around the Web
Below are the latest news stories about GLOBALSTAR INC that investors may wish to consider to help them evaluate GSAT as an investment opportunity.
Zacks Industry Outlook Highlights Iridium Communications, Globalstar and Eutelsat GroupIridium Communications, Globalstar and Eutelsat Group have been highlighted in this Industry Outlook article. |
Crown Castle gives in to Elliott's pressure: Insider trades & hedge funds weeklyHere is your Pro Recap of the biggest insider trades and institutional investor headlines you may have missed this week: Crown Castle announces a review of its fiber business and the replacement of two board members as it gives in to Elliott's demands, and top brass buys at Complete Solaria, GlobalStar, and Beyond Air. On Wednesday, Crown Castle International (NYSE:CCI) announced a comprehensive review of its fiber business and the replacement of two board members. |
3 Stocks to Watch From the Satellite and Communication IndustryGlobal security threats and increasing defense budgets bode well for Zacks Satellite and Communication industry participants like Iridium (IRDM), Globalstar (GSAT) and Eutelsat Group (EUTLF). |
Q3 2023 Rocket Lab USA Inc Earnings CallQ3 2023 Rocket Lab USA Inc Earnings Call |
Globalstar, Inc. (AMEX:GSAT) Q3 2023 Earnings Call TranscriptGlobalstar, Inc. (AMEX:GSAT) Q3 2023 Earnings Call Transcript November 4, 2023 Operator: Good day, and thank you for standing by. Welcome to the Globalstar 3Q 2023 Earnings Conference Call. [Operator Instructions] Please be advised that today’s conference is being recorded. I would now like to hand the conference over to your first speaker today, Globalstar […] |
GSAT Price Returns
| 1-mo | 17.92% |
| 3-mo | -3.10% |
| 6-mo | -22.36% |
| 1-year | 19.05% |
| 3-year | -8.76% |
| 5-year | 170.27% |
| YTD | -35.57% |
| 2023 | 45.86% |
| 2022 | 14.66% |
| 2021 | 242.59% |
| 2020 | -34.72% |
| 2019 | -18.95% |
Loading social stream, please wait...