
Garrett Motion Inc. (GTX): Price and Financial Metrics
GTX Price/Volume Stats
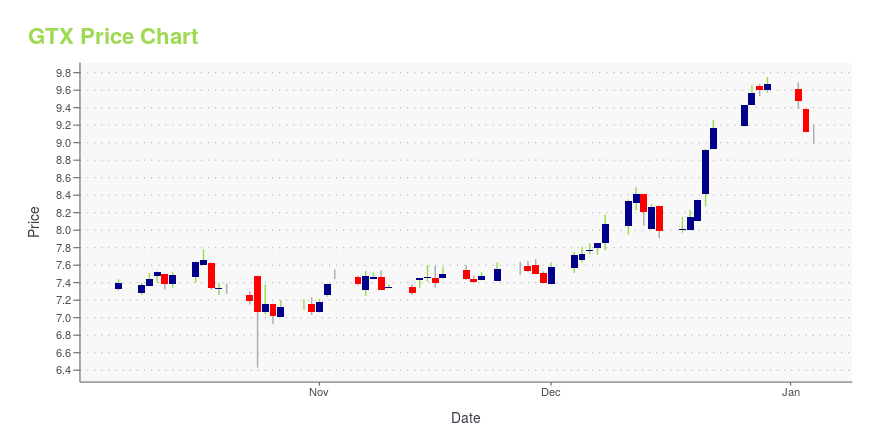
| Current price | $8.76 | 52-week high | $10.16 |
| Prev. close | $8.06 | 52-week low | $6.43 |
| Day low | $8.09 | Volume | 1,888,800 |
| Day high | $8.79 | Avg. volume | 998,851 |
| 50-day MA | $8.92 | Dividend yield | N/A |
| 200-day MA | $8.78 | Market Cap | 1.98B |
GTX Stock Price Chart Interactive Chart >
Garrett Motion Inc. (GTX) Company Bio
Garrett Motion Inc. (spun out of Honeywell) designs, manufactures and sells highly engineered turbocharger and electric boosting technologies for light and commercial vehicle original equipment manufacturers and the aftermarket.
Latest GTX News From Around the Web
Below are the latest news stories about GARRETT MOTION INC that investors may wish to consider to help them evaluate GTX as an investment opportunity.
Garrett Motion, Global Leader in Turbochargers, Launches Online Marketplace for Racing EnthusiastsROLLE, SWITZERLAND / ACCESSWIRE / December 11, 2023 / Garrett Motion (NASDAQ:GTX), a leader in differentiated technologies for the automotive industry, announced that Garrett Performance launched an advanced e-commerce platform, Garrett Marketplace. ... |
Is the Automotive Industry's Transition to 100% Battery Electric Vehicles (EVs) the Most Effective Way to Decarbonize European Transport?Garrett Motion White Paper Tackles Key Question Regarding Vehicle CO2 EmissionsVehicle lifecycle study (LCA) evaluates the years of use required for battery electric vehicles (BEVs) and hybrids to off-set the significant amount of C02 emissions generated ... |
New Strong Sell Stocks for November 29thGTX, MOND and LSTR have been added to the Zacks Rank #5 (Strong Sell) List on November 29, 2023. |
Garrett Motion White Paper Tackles Key Question Regarding Vehicle CO2 Emissions:Garrett Motion Inc. (Nasdaq: GTX), a differentiated technology provider for the automotive industry, has published a white paper titled "Is the automotive industry's transition to 100 percent electric vehicles the most effective way to decarbonize European transport?" The study compares the CO2 emissions generated by battery electric vehicles versus hybrid vehicles throughout their lifecycle, including the manufacture and use of these vehicles. |
12 Best Value Stocks To Buy Heading Into 2024 (Picked By Seth Klarman)In this piece, we will take a look at the 12 best value stocks picked by Seth Klarman to buy heading into 2024. If you want to skip. our introduction to the billionaire hedge fund investor, value investing, and the current stock market investing climate, then take a look at 5 Best Value Stocks To […] |
GTX Price Returns
| 1-mo | 3.06% |
| 3-mo | -10.89% |
| 6-mo | -0.45% |
| 1-year | 12.74% |
| 3-year | 29.97% |
| 5-year | N/A |
| YTD | -9.41% |
| 2023 | 26.90% |
| 2022 | -5.11% |
| 2021 | N/A |
| 2020 | N/A |
| 2019 | N/A |
Continue Researching GTX
Want to do more research on Garrett Motion Inc's stock and its price? Try the links below:Garrett Motion Inc (GTX) Stock Price | Nasdaq
Garrett Motion Inc (GTX) Stock Quote, History and News - Yahoo Finance
Garrett Motion Inc (GTX) Stock Price and Basic Information | MarketWatch
Loading social stream, please wait...