Hudbay Minerals Inc. (HBM): Price and Financial Metrics
HBM Price/Volume Stats
Current price | $6.92 | 52-week high | $7.02 |
Prev. close | $6.74 | 52-week low | $3.94 |
Day low | $6.69 | Volume | 1,795,200 |
Day high | $6.92 | Avg. volume | 2,027,742 |
50-day MA | $5.88 | Dividend yield | 0.22% |
200-day MA | $5.15 | Market Cap | 2.43B |
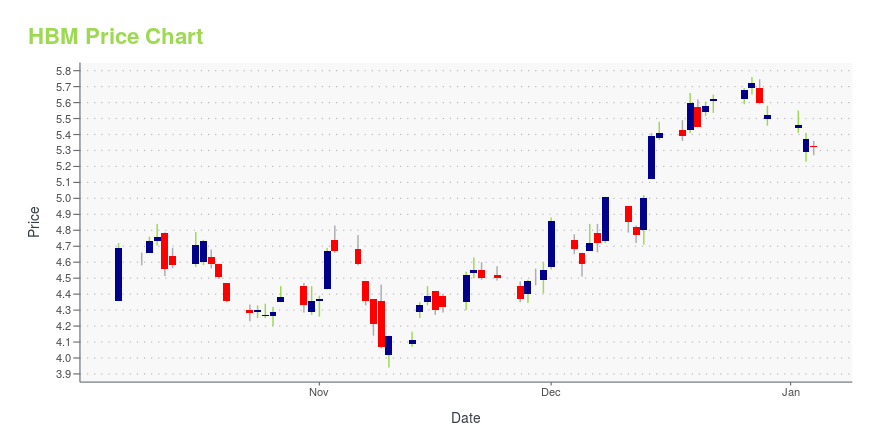
HBM Stock Price Chart Interactive Chart >
HBM POWR Grades
- HBM scores best on the Growth dimension, with a Growth rank ahead of 99.24% of US stocks.
- HBM's strongest trending metric is Growth; it's been moving up over the last 26 weeks.
- HBM ranks lowest in Sentiment; there it ranks in the 7th percentile.
HBM Stock Summary
- HBM's current price/earnings ratio is 102.9, which is higher than 93.92% of US stocks with positive earnings.
- For HBM, its debt to operating expenses ratio is greater than that reported by 96.7% of US equities we're observing.
- Revenue growth over the past 12 months for HUDBAY MINERALS INC comes in at -9.99%, a number that bests merely 22.22% of the US stocks we're tracking.
- Stocks with similar financial metrics, market capitalization, and price volatility to HUDBAY MINERALS INC are ENTG, ACIW, THRM, CNHI, and SSNC.
- HBM's SEC filings can be seen here. And to visit HUDBAY MINERALS INC's official web site, go to www.hudbayminerals.com.
HBM Valuation Summary
- HBM's price/sales ratio is 1.4; this is 6.67% lower than that of the median Basic Materials stock.
- Over the past 181 months, HBM's price/sales ratio has gone up 0.9.
Below are key valuation metrics over time for HBM.
Stock | Date | P/S | P/B | P/E | EV/EBIT |
---|---|---|---|---|---|
HBM | 2023-12-29 | 1.4 | 0.9 | 105.8 | 25.0 |
HBM | 2023-12-28 | 1.4 | 1.0 | 107.3 | 25.2 |
HBM | 2023-12-27 | 1.4 | 1.0 | 109.6 | 25.5 |
HBM | 2023-12-26 | 1.4 | 1.0 | 108.8 | 25.4 |
HBM | 2023-12-22 | 1.4 | 1.0 | 107.7 | 25.3 |
HBM | 2023-12-21 | 1.4 | 1.0 | 106.9 | 25.2 |
HBM Growth Metrics
- Its 3 year revenue growth rate is now at 13.72%.
- Its 5 year net income to common stockholders growth rate is now at -1772.55%.
- Its 5 year price growth rate is now at -58.7%.
The table below shows HBM's growth in key financial areas (numbers in millions of US dollars).
Date | Revenue | Operating Cash Flow | Net Income to Common Stock |
---|---|---|---|
2022-12-31 | 1,461.44 | 487.803 | 70.382 |
2022-09-30 | 1,565.414 | 497.27 | 77.37 |
2022-06-30 | 1,578.204 | 464.56 | -84.906 |
2022-03-31 | 1,566.992 | 395.332 | -120.444 |
2021-12-31 | 1,501.998 | 383.816 | -244.358 |
2021-12-31 | 1,501.998 | 383.816 | -244.358 |
HBM's Quality Factors
The “Quality” component of the POWR Ratings focuses on 31 different factors of a companies fundamentals and operational strength. Here are some key insights as we drill into the specifics of these quality attributes.- HBM has a Quality Grade of C, ranking ahead of 25.72% of graded US stocks.
- HBM's asset turnover comes in at 0.239 -- ranking 24th of 42 Non-Metallic and Industrial Metal Mining stocks.
- 500 - Internal server error
The table below shows HBM's key quality metrics over time.
Period | Asset Turnover | Gross Margin | ROIC |
---|---|---|---|
2020-12-31 | 0.239 | 0.036 | -0.019 |
2019-12-31 | 0.271 | 0.122 | -0.060 |
2018-12-31 | 0.315 | 0.254 | 0.065 |
2017-12-31 | 0.299 | 0.274 | 0.059 |
2016-12-31 | 0.253 | 0.197 | 0.032 |
2015-12-31 | 0.175 | 0.134 | -0.057 |
HBM Price Target
For more insight on analysts targets of HBM, see our HBM price target page. And for a list of of all stocks sorted by upside potential based on analyst target price, see our Top Price Target page.
Average Price Target | $10.30 | Average Broker Recommendation | 1.33 (Strong Buy) |
Hudbay Minerals Inc. (HBM) Company Bio
Hudbay Minerals focuses on the discovery, production, and marketing of base and precious metals in North and South America. It produces copper concentrates containing copper, gold, and silver; and zinc metal. The company was founded in 1927 and is based in Toronto, Canada.
Latest HBM News From Around the Web
Below are the latest news stories about HUDBAY MINERALS INC that investors may wish to consider to help them evaluate HBM as an investment opportunity.
12 Best Junior Silver Mining Stocks To Buy NowIn this piece, we will take a look at the 12 best junior silver mining stocks to buy now. If you want to skip our overview of the mining industry, then you can take a look at the 5 Best Junior Silver Mining Stocks To Buy Now. The mining industry is essential for proper global […] |
Hudbay Minerals Inc.'s (TSE:HBM) Stock On An Uptrend: Could Fundamentals Be Driving The Momentum?Hudbay Minerals' (TSE:HBM) stock is up by a considerable 21% over the past month. Given that stock prices are usually... |
Hudbay Releases Copper Mountain Technical Report and Advances Mine Stabilization PlansFigure 1 Copper Mountain Mine Location Figure 2 Copper Mountain Site Layout Figure 3 Hudbay Consolidated Production Profile Graph Figure 4 Copper Mountain Mine Performance Average annual copper production of 46,500 tonnes over the first five years with cash costs of $1.89i per pound, and 45,000 tonnes over the first 10 years with cash costs of $1.72i per pound. Represents an approximate 90% increase over 2022 production levels and 50% decrease from 2022 cash costs as a result of the implementati |
Hudbay Further Enhances Financial Flexibility with Redemption of Remaining Copper Mountain BondsTORONTO, Nov. 15, 2023 (GLOBE NEWSWIRE) -- Hudbay Minerals Inc. (“Hudbay”) (TSX, NYSE: HBM) today announced that its wholly owned subsidiary, Copper Mountain Mining ULC (“Copper Mountain”), has exercised the redemption option on its senior secured 8% notes (the “Copper Mountain Bonds”). Copper Mountain will redeem the remaining $54.7 million principal amount outstanding of Copper Mountain Bonds on or about November 30, 2023 at a call price equal to 104% of the principal amount being redeemed, pl |
Hudbay Minerals Inc. (NYSE:HBM) Q3 2023 Earnings Call TranscriptHudbay Minerals Inc. (NYSE:HBM) Q3 2023 Earnings Call Transcript November 9, 2023 Operator: Good morning, ladies and gentlemen. Thank you for standing by. Welcome to the Hudbay Third Quarter 2023 Results Conference Call. At this time all participants are in listen-only mode. Following the presentation we will conduct a question-and-answer session. [Operator Instructions]. I would […] |
HBM Price Returns
1-mo | 18.90% |
3-mo | 25.36% |
6-mo | 42.09% |
1-year | 37.50% |
3-year | 9.03% |
5-year | -1.88% |
YTD | 25.36% |
2023 | 9.17% |
2022 | -29.87% |
2021 | 3.71% |
2020 | 69.20% |
2019 | -11.76% |
HBM Dividends
Ex-Dividend Date | Type | Payout Amount | Change | ||||||
---|---|---|---|---|---|---|---|---|---|
Loading, please wait... |
Continue Researching HBM
Want to do more research on Hudbay Minerals Inc's stock and its price? Try the links below:Hudbay Minerals Inc (HBM) Stock Price | Nasdaq
Hudbay Minerals Inc (HBM) Stock Quote, History and News - Yahoo Finance
Hudbay Minerals Inc (HBM) Stock Price and Basic Information | MarketWatch
Loading social stream, please wait...