
Hackett Group Inc. (HCKT): Price and Financial Metrics
HCKT Price/Volume Stats
| Current price | $26.02 | 52-week high | $26.69 |
| Prev. close | $25.11 | 52-week low | $20.23 |
| Day low | $25.34 | Volume | 132,401 |
| Day high | $26.04 | Avg. volume | 95,238 |
| 50-day MA | $22.31 | Dividend yield | 1.78% |
| 200-day MA | $22.83 | Market Cap | 718.52M |
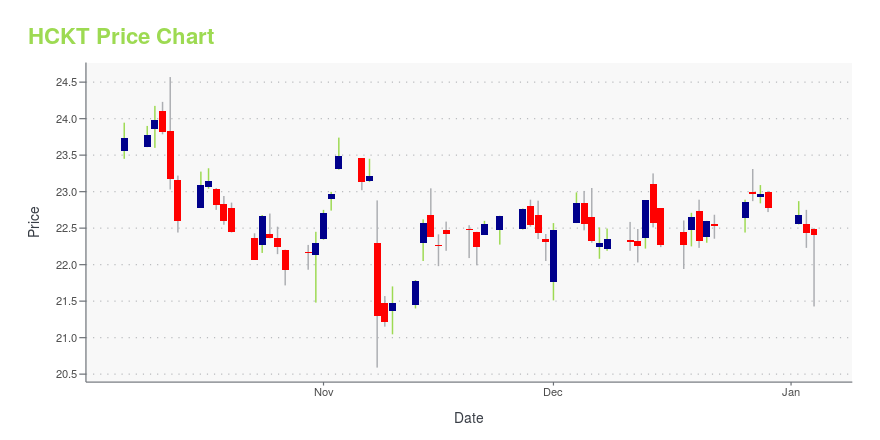
HCKT Stock Price Chart Interactive Chart >
Hackett Group Inc. (HCKT) Company Bio
The Hackett Group, Inc. operates as a strategic advisory and technology consulting firm primarily in the United States and Western Europe. The company offers executive advisory programs, benchmarking, business transformation, and technology consulting services with corresponding offshore support. The company was formerly known as Answerthink, Inc. and changed its name to The Hackett Group, Inc. in 2008. The company was founded in 1991 and is based in Miami, Florida.
Latest HCKT News From Around the Web
Below are the latest news stories about HACKETT GROUP INC that investors may wish to consider to help them evaluate HCKT as an investment opportunity.
Here's What We Like About Hackett Group's (NASDAQ:HCKT) Upcoming DividendThe Hackett Group, Inc. ( NASDAQ:HCKT ) stock is about to trade ex-dividend in 4 days. The ex-dividend date is one... |
The Hackett Group: New FAO Service Provider Research Finds Wealth of Mature, Well-Established SolutionsMIAMI, December 13, 2023--A new Hackett Value Matrix™ analysis of 15 leading finance and accounting outsourcing (FAO) service providers by The Hackett Group, Inc. (NASDAQ: HCKT) finds that the market contains many mature and well-established service providers that deliver comparable levels of value realization and breadth of capabilities. The research recommends that companies seek assistance from expert advisors in the selection process to help them identify the partner(s) that best address the |
Hackett Group (NASDAQ:HCKT) Has Affirmed Its Dividend Of $0.11The Hackett Group, Inc. ( NASDAQ:HCKT ) will pay a dividend of $0.11 on the 5th of January. This payment means that the... |
The Hackett Group Launches Ai XPLR: A Pioneering Gen AI Readiness and Opportunity AssessmentMIAMI, December 07, 2023--The Hackett Group, Inc. (NASDAQ: HCKT), a leading benchmarking, executive advisory and strategic consultancy, has launched Ai XPLR™, a readiness and opportunity assessment that leverages the extensive proprietary benchmark database of The Hackett Group® to enable companies to quickly and comprehensively identify opportunities to harness artificial intelligence (AI) across key business services domains, including finance, procurement, human resources and global business |
At US$22.67, Is It Time To Put The Hackett Group, Inc. (NASDAQ:HCKT) On Your Watch List?The Hackett Group, Inc. ( NASDAQ:HCKT ), might not be a large cap stock, but it saw significant share price movement... |
HCKT Price Returns
| 1-mo | 21.19% |
| 3-mo | 19.15% |
| 6-mo | 12.89% |
| 1-year | 17.88% |
| 3-year | 55.10% |
| 5-year | 72.18% |
| YTD | 15.37% |
| 2023 | 14.15% |
| 2022 | 1.48% |
| 2021 | 45.86% |
| 2020 | -8.83% |
| 2019 | 3.08% |
HCKT Dividends
| Ex-Dividend Date | Type | Payout Amount | Change | ||||||
|---|---|---|---|---|---|---|---|---|---|
| Loading, please wait... | |||||||||
Continue Researching HCKT
Want to see what other sources are saying about Hackett Group Inc's financials and stock price? Try the links below:Hackett Group Inc (HCKT) Stock Price | Nasdaq
Hackett Group Inc (HCKT) Stock Quote, History and News - Yahoo Finance
Hackett Group Inc (HCKT) Stock Price and Basic Information | MarketWatch
Loading social stream, please wait...