Healthcare Services Group, Inc. (HCSG): Price and Financial Metrics

Healthcare Services Group, Inc. (HCSG): $12.48

0.05 (-0.40%)

POWR Rating

Component Grades

Momentum

C

Stability

C

Sentiment

Quality

C

HCSG Price/Volume Stats

Current price $12.48 52-week high $15.97
Prev. close $12.53 52-week low $8.75
Day low $12.46 Volume 398,400
Day high $12.62 Avg. volume 568,751
50-day MA $11.30 Dividend yield N/A
200-day MA $11.39 Market Cap 918.32M

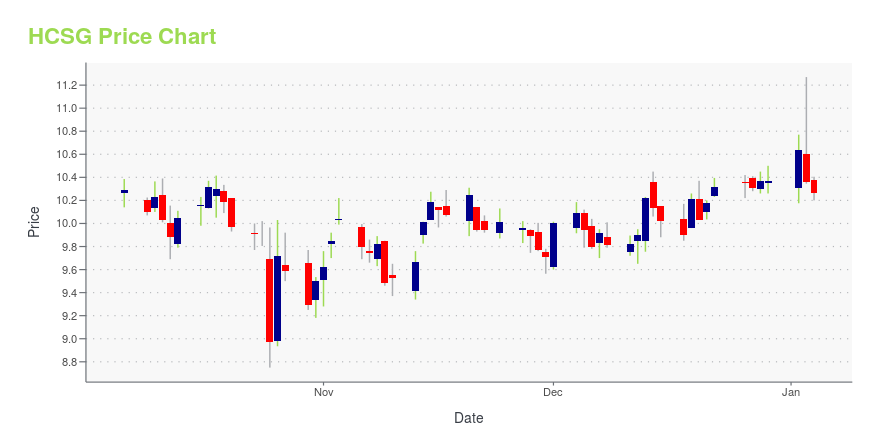
HCSG Stock Price Chart Interactive Chart >

HCSG POWR Grades

  • HCSG scores best on the Value dimension, with a Value rank ahead of 81.31% of US stocks.
  • The strongest trend for HCSG is in Growth, which has been heading down over the past 26 weeks.
  • HCSG's current lowest rank is in the Growth metric (where it is better than 9.12% of US stocks).

HCSG Stock Summary

  • The price/operating cash flow metric for HEALTHCARE SERVICES GROUP INC is higher than 92.28% of stocks in our set with a positive cash flow.
  • Of note is the ratio of HEALTHCARE SERVICES GROUP INC's sales and general administrative expense to its total operating expenses; 87.34% of US stocks have a lower such ratio.
  • With a year-over-year growth in debt of 67.85%, HEALTHCARE SERVICES GROUP INC's debt growth rate surpasses 89.1% of about US stocks.
  • If you're looking for stocks that are quantitatively similar to HEALTHCARE SERVICES GROUP INC, a group of peers worth examining would be MIXT, KRT, VSH, BRID, and SHOO.
  • Visit HCSG's SEC page to see the company's official filings. To visit the company's web site, go to www.hcsgcorp.com.

HCSG Valuation Summary

  • HCSG's EV/EBIT ratio is 16.1; this is 10.27% higher than that of the median Healthcare stock.
  • HCSG's EV/EBIT ratio has moved up 6.2 over the prior 243 months.

Below are key valuation metrics over time for HCSG.

Stock Date P/S P/B P/E EV/EBIT
HCSG 2023-12-29 0.5 1.7 24.0 16.1
HCSG 2023-12-28 0.5 1.7 24.0 16.1
HCSG 2023-12-27 0.5 1.7 23.8 16.0
HCSG 2023-12-26 0.5 1.7 23.9 16.1
HCSG 2023-12-22 0.5 1.7 23.9 16.0
HCSG 2023-12-21 0.4 1.7 23.5 15.8

HCSG Growth Metrics

    Its 5 year net cashflow from operations growth rate is now at 33.66%.
  • Its 4 year net cashflow from operations growth rate is now at 33.66%.
  • Its 5 year revenue growth rate is now at 14.63%.
HCSG's revenue has moved down $154,175,000 over the prior 33 months.

The table below shows HCSG's growth in key financial areas (numbers in millions of US dollars).

Date Revenue Operating Cash Flow Net Income to Common Stock
2022-09-30 1,686.603 0.317 20.576
2022-06-30 1,687.705 -12.898 29.794
2022-03-31 1,661.019 3.424 32.539
2021-12-31 1,641.959 37.108 45.863
2021-09-30 1,644.689 81.395 71.505
2021-06-30 1,665.046 153.672 89.609

HCSG's Quality Factors

The “Quality” component of the POWR Ratings focuses on 31 different factors of a companies fundamentals and operational strength. Here are some key insights as we drill into the specifics of these quality attributes.
  • HCSG has a Quality Grade of C, ranking ahead of 53.04% of graded US stocks.
  • HCSG's asset turnover comes in at 2.069 -- ranking 3rd of 81 Healthcare stocks.
  • CHE, VCYT, and NTRA are the stocks whose asset turnover ratios are most correlated with HCSG.

The table below shows HCSG's key quality metrics over time.

Period Asset Turnover Gross Margin ROIC
2021-09-30 2.069 0.155 0.212
2021-06-30 2.121 0.165 0.272
2021-03-31 2.248 0.161 0.310
2020-12-31 2.341 0.152 0.294
2020-09-30 2.423 0.144 0.264
2020-06-30 2.473 0.135 0.234

HCSG Price Target

For more insight on analysts targets of HCSG, see our HCSG price target page. And for a list of of all stocks sorted by upside potential based on analyst target price, see our Top Price Target page.

Average Price Target $29.23 Average Broker Recommendation 1.91 (Hold)

Healthcare Services Group, Inc. (HCSG) Company Bio


Healthcare Services Group provides management, administrative, and operating services to the housekeeping, laundry, linen, facility maintenance, and dietary service departments to nursing homes, retirement complexes, rehabilitation centers, and hospitals in the United States. It operates in two segments, Housekeeping and Dietary. The company was founded in 1976 and is based in Bensalem, Pennsylvania.


HCSG Latest News Stream


Event/Time News Detail
Loading, please wait...

HCSG Latest Social Stream


Loading social stream, please wait...

View Full HCSG Social Stream

Latest HCSG News From Around the Web

Below are the latest news stories about HEALTHCARE SERVICES GROUP INC that investors may wish to consider to help them evaluate HCSG as an investment opportunity.

Is Healthcare Services Group, Inc.'s (NASDAQ:HCSG) Stock Price Struggling As A Result Of Its Mixed Financials?

Healthcare Services Group (NASDAQ:HCSG) has had a rough three months with its share price down 25%. It seems that the...

Yahoo | November 13, 2023

The Healthcare Services Group Inc (HCSG) Company: A Short SWOT Analysis

Unveiling the Strengths, Weaknesses, Opportunities, and Threats in the Midst of a Challenging Healthcare Environment

Yahoo | October 30, 2023

Estimating The Fair Value Of Healthcare Services Group, Inc. (NASDAQ:HCSG)

Key Insights Using the Dividend Discount Model, Healthcare Services Group fair value estimate is US$8.62 With US$9.72...

Yahoo | October 27, 2023

7 Undervalued Stocks That Analysts Love Right Now

Ahead of possible volatility in the market, investors may find some measure of confidence in undervalued stocks.

Josh Enomoto on InvestorPlace | October 26, 2023

Healthcare Services Group, Inc. (NASDAQ:HCSG) Q3 2023 Earnings Call Transcript

Healthcare Services Group, Inc. (NASDAQ:HCSG) Q3 2023 Earnings Call Transcript October 25, 2023 Healthcare Services Group, Inc. misses on earnings expectations. Reported EPS is $-0.07388 EPS, expectations were $0.17. Operator: Good morning. My name is Rob, and I’ll be your conference operator today. At this time, I would like to welcome everyone to the Healthcare […]

Yahoo | October 26, 2023

Read More 'HCSG' Stories Here

HCSG Price Returns

1-mo -1.65%
3-mo 20.35%
6-mo 19.65%
1-year -9.17%
3-year -52.15%
5-year -56.22%
YTD 20.35%
2023 -13.58%
2022 -28.66%
2021 -34.56%
2020 19.52%
2019 -37.76%

Get Free Updates

Join thousands of investors who get the latest news, insights and top rated picks from StockNews.com!