Healthcare Services Group, Inc. (HCSG): Price and Financial Metrics
GET POWR RATINGS... FREE!
HCSG POWR Grades
- Value is the dimension where HCSG ranks best; there it ranks ahead of 76.22% of US stocks.
- The strongest trend for HCSG is in Growth, which has been heading up over the past 179 days.
- HCSG's current lowest rank is in the Sentiment metric (where it is better than 1.43% of US stocks).
HCSG Stock Summary
- Healthcare Services Group Inc's capital turnover -- a measure of revenue relative to shareholder's equity -- is better than 87.29% of US listed stocks.
- The ratio of debt to operating expenses for Healthcare Services Group Inc is higher than it is for about merely 11.46% of US stocks.
- Revenue growth over the past 12 months for Healthcare Services Group Inc comes in at -6.72%, a number that bests only 12.4% of the US stocks we're tracking.
- If you're looking for stocks that are quantitatively similar to Healthcare Services Group Inc, a group of peers worth examining would be JVA, SMID, HWKN, FLXS, and ODC.
- HCSG's SEC filings can be seen here. And to visit Healthcare Services Group Inc's official web site, go to www.hcsgcorp.com.
HCSG Valuation Summary
- HCSG's price/sales ratio is 1.2; this is 89.43% lower than that of the median Healthcare stock.
- Over the past 243 months, HCSG's price/earnings ratio has gone up 5.2.
Below are key valuation metrics over time for HCSG.
Stock | Date | P/S | P/B | P/E | EV/EBIT |
---|---|---|---|---|---|
HCSG | 2021-08-31 | 1.2 | 4.0 | 21.8 | 15.2 |
HCSG | 2021-08-30 | 1.2 | 4.0 | 21.9 | 15.2 |
HCSG | 2021-08-27 | 1.2 | 4.0 | 21.9 | 15.2 |
HCSG | 2021-08-26 | 1.2 | 3.9 | 21.4 | 14.9 |
HCSG | 2021-08-25 | 1.2 | 3.9 | 21.5 | 14.9 |
HCSG | 2021-08-24 | 1.2 | 3.9 | 21.5 | 14.9 |
HCSG Growth Metrics
- Its 2 year net income to common stockholders growth rate is now at 14.08%.
- Its 4 year net income to common stockholders growth rate is now at 23.69%.
- Its 2 year cash and equivalents growth rate is now at 514.91%.

The table below shows HCSG's growth in key financial areas (numbers in millions of US dollars).
Date | Revenue | Operating Cash Flow | Net Income to Common Stock |
---|---|---|---|
2021-12-31 | 1,641.959 | 37.108 | 45.863 |
2021-09-30 | 1,644.689 | 81.395 | 71.505 |
2021-06-30 | 1,665.046 | 153.672 | 89.609 |
2021-03-31 | 1,718.904 | 208.027 | 103.145 |
2020-12-31 | 1,760.303 | 217.213 | 98.682 |
2020-09-30 | 1,784.086 | 154.908 | 89.83 |
HCSG's Quality Factors
The “Quality” component of the POWR Ratings focuses on 31 different factors of a companies fundamentals and operational strength. Here are some key insights as we drill into the specifics of these quality attributes.- HCSG has a Quality Grade of C, ranking ahead of 53.04% of graded US stocks.
- HCSG's asset turnover comes in at 2.069 -- ranking 3rd of 81 Healthcare stocks.
- CHE, VCYT, and NTRA are the stocks whose asset turnover ratios are most correlated with HCSG.
The table below shows HCSG's key quality metrics over time.
Period | Asset Turnover | Gross Margin | ROIC |
---|---|---|---|
2021-09-30 | 2.069 | 0.155 | 0.212 |
2021-06-30 | 2.121 | 0.165 | 0.272 |
2021-03-31 | 2.248 | 0.161 | 0.310 |
2020-12-31 | 2.341 | 0.152 | 0.294 |
2020-09-30 | 2.423 | 0.144 | 0.264 |
2020-06-30 | 2.473 | 0.135 | 0.234 |
HCSG Price Target
For more insight on analysts targets of HCSG, see our HCSG price target page. And for a list of of all stocks sorted by upside potential based on analyst target price, see our Top Price Target page.
Average Price Target | $29.23 | Average Broker Recommendation | 1.91 (Hold) |
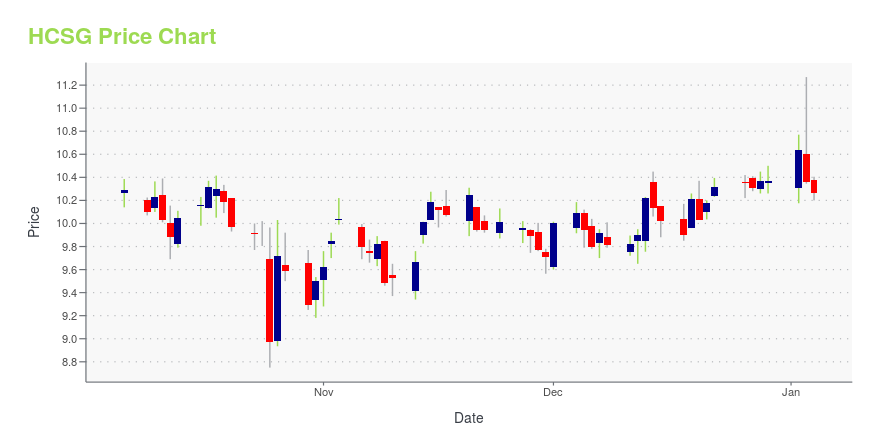
HCSG Stock Price Chart Interactive Chart >
HCSG Price/Volume Stats
Current price | $17.60 | 52-week high | $32.19 |
Prev. close | $17.41 | 52-week low | $14.75 |
Day low | $17.26 | Volume | 368,200 |
Day high | $17.64 | Avg. volume | 997,787 |
50-day MA | $17.13 | Dividend yield | 4.83% |
200-day MA | $18.39 | Market Cap | 1.30B |
Healthcare Services Group, Inc. (HCSG) Company Bio
Healthcare Services Group provides management, administrative, and operating services to the housekeeping, laundry, linen, facility maintenance, and dietary service departments to nursing homes, retirement complexes, rehabilitation centers, and hospitals in the United States. It operates in two segments, Housekeeping and Dietary. The company was founded in 1976 and is based in Bensalem, Pennsylvania.
Latest HCSG News From Around the Web
Below are the latest news stories about Healthcare Services Group Inc that investors may wish to consider to help them evaluate HCSG as an investment opportunity.
Healthcare Services Group: 5.2% Dividend Yield And 18 Straight Years Of Dividend GrowthThesis: Better Days Ahead Healthcare Services Group (HCSG), as the name would imply, is one of the largest third-party providers of various services such as housekeeping, dining, nutrition planning, and laundry to healthcare providers such as hospitals, nursing homes, and senior living centers. They manage some or all of these... |
Here's Why We're Wary Of Buying Healthcare Services Group's (NASDAQ:HCSG) For Its Upcoming DividendIt looks like Healthcare Services Group, Inc. ( NASDAQ:HCSG ) is about to go ex-dividend in the next four days... |
Healthcare Services Group (NASDAQ:HCSG) Will Pay A Larger Dividend Than Last Year At US$0.21Healthcare Services Group, Inc. ( NASDAQ:HCSG ) will increase its dividend on the 25th of March to US$0.21. This takes... |
Healthcare Services Group: Q4 Earnings InsightsHealthcare Services Group (NASDAQ: HCSG ) reported its Q4 earnings results on Wednesday, February 9, 2022 at 07:00 AM. Here''s what investors need to know about the announcement. Earnings Healthcare Services Group missed estimated earnings by 76.92%, reporting an EPS of $0.03 … Full story available on Benzinga.com |
Healthcare Services GAAP EPS of $0.03 misses by $0.10, revenue of $420.45M beats by $3.43MHealthcare Services press release (HCSG): Q4 GAAP EPS of $0.03 misses by $0.10.Revenue of $420.45M (-0.6% Y/Y) beats by $3.43M. |
HCSG Price Returns
1-mo | -0.11% |
3-mo | 0.98% |
6-mo | -0.58% |
1-year | -41.72% |
3-year | -34.97% |
5-year | -56.17% |
YTD | 1.55% |
2021 | -34.56% |
2020 | 19.52% |
2019 | -37.76% |
2018 | -22.39% |
2017 | 36.78% |
HCSG Dividends
Ex-Dividend Date | Type | Payout Amount | Change | ||||||
---|---|---|---|---|---|---|---|---|---|
Loading, please wait... |
Continue Researching HCSG
Want to do more research on Healthcare Services Group Inc's stock and its price? Try the links below:Healthcare Services Group Inc (HCSG) Stock Price | Nasdaq
Healthcare Services Group Inc (HCSG) Stock Quote, History and News - Yahoo Finance
Healthcare Services Group Inc (HCSG) Stock Price and Basic Information | MarketWatch
Loading social stream, please wait...