H&E Equipment Services, Inc. (HEES): Price and Financial Metrics
GET POWR RATINGS... FREE!
HEES POWR Grades
- HEES scores best on the Growth dimension, with a Growth rank ahead of 99.53% of US stocks.
- The strongest trend for HEES is in Growth, which has been heading up over the past 177 days.
- HEES's current lowest rank is in the Value metric (where it is better than 28.97% of US stocks).
HEES Stock Summary
- H&E EQUIPMENT SERVICES INC's capital turnover -- a measure of revenue relative to shareholder's equity -- is better than 84.62% of US listed stocks.
- Of note is the ratio of H&E EQUIPMENT SERVICES INC's sales and general administrative expense to its total operating expenses; 97.03% of US stocks have a lower such ratio.
- Over the past twelve months, HEES has reported earnings growth of 130.39%, putting it ahead of 88.8% of US stocks in our set.
- Stocks that are quantitatively similar to HEES, based on their financial statements, market capitalization, and price volatility, are SIRE, AVNT, TILE, JBI, and PPC.
- HEES's SEC filings can be seen here. And to visit H&E EQUIPMENT SERVICES INC's official web site, go to www.he-equipment.com.
HEES Valuation Summary
- In comparison to the median Industrials stock, HEES's price/sales ratio is 15.38% higher, now standing at 1.5.
- Over the past 207 months, HEES's price/sales ratio has gone down 0.3.
Below are key valuation metrics over time for HEES.
Stock | Date | P/S | P/B | P/E | EV/EBIT |
---|---|---|---|---|---|
HEES | 2023-01-24 | 1.5 | 5.0 | 13.4 | 13.3 |
HEES | 2023-01-23 | 1.5 | 5.0 | 13.4 | 13.3 |
HEES | 2023-01-20 | 1.5 | 4.9 | 13.0 | 13.1 |
HEES | 2023-01-19 | 1.5 | 4.8 | 12.8 | 13.0 |
HEES | 2023-01-18 | 1.5 | 4.8 | 12.9 | 13.1 |
HEES | 2023-01-17 | 1.5 | 4.8 | 12.9 | 13.0 |
HEES Growth Metrics
- Its 4 year net income to common stockholders growth rate is now at -2.67%.
- The 2 year net cashflow from operations growth rate now stands at -20.17%.
- Its 5 year net income to common stockholders growth rate is now at -2.67%.

The table below shows HEES's growth in key financial areas (numbers in millions of US dollars).
Date | Revenue | Operating Cash Flow | Net Income to Common Stock |
---|---|---|---|
2022-09-30 | 1,172.653 | 268.71 | 134.104 |
2022-06-30 | 1,123.809 | 283.302 | 125.265 |
2022-03-31 | 1,144.901 | 251.142 | 114.685 |
2021-12-31 | 1,062.797 | 259.572 | 102.54 |
2021-09-30 | 1,185.246 | 270.987 | 34.837 |
2021-06-30 | 1,199.07 | 206.009 | 15.403 |
HEES's Quality Factors
The “Quality” component of the POWR Ratings focuses on 31 different factors of a companies fundamentals and operational strength. Here are some key insights as we drill into the specifics of these quality attributes.- HEES has a Quality Grade of B, ranking ahead of 80.68% of graded US stocks.
- HEES's asset turnover comes in at 0.585 -- ranking 272nd of 561 Business Services stocks.
- APPF, TCX, and QLYS are the stocks whose asset turnover ratios are most correlated with HEES.
The table below shows HEES's key quality metrics over time.
Period | Asset Turnover | Gross Margin | ROIC |
---|---|---|---|
2021-09-30 | 0.585 | 0.358 | 0.032 |
2021-06-30 | 0.616 | 0.341 | 0.026 |
2021-03-31 | 0.616 | 0.336 | 0.024 |
2020-12-31 | 0.634 | 0.344 | 0.007 |
2020-09-30 | 0.653 | 0.354 | 0.024 |
2020-06-30 | 0.657 | 0.362 | 0.031 |
HEES Price Target
For more insight on analysts targets of HEES, see our HEES price target page. And for a list of of all stocks sorted by upside potential based on analyst target price, see our Top Price Target page.
Average Price Target | $41.00 | Average Broker Recommendation | 1.25 (Strong Buy) |
HEES Stock Price Chart Interactive Chart >
HEES Price/Volume Stats
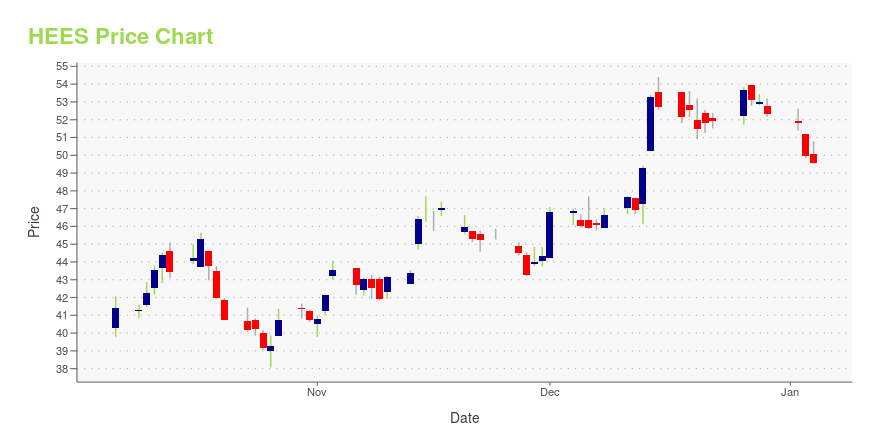
Current price | $50.78 | 52-week high | $51.00 |
Prev. close | $50.18 | 52-week low | $26.12 |
Day low | $49.75 | Volume | 172,500 |
Day high | $51.00 | Avg. volume | 256,356 |
50-day MA | $45.02 | Dividend yield | 2.17% |
200-day MA | $36.09 | Market Cap | 1.84B |
H&E Equipment Services, Inc. (HEES) Company Bio
H&E Equipment Services is focused on heavy construction and industrial equipment and rents, sells and provides parts and service support for four core categories of specialized equipment: hi-lift or aerial platform equipment, cranes, earthmoving equipment, and industrial lift trucks. The company was founded in 1961 and is based in Baton Rouge, Louisiana.
Latest HEES News From Around the Web
Below are the latest news stories about H&E EQUIPMENT SERVICES INC that investors may wish to consider to help them evaluate HEES as an investment opportunity.
H&E Equipment (HEES) Gains As Market Dips: What You Should KnowH&E Equipment (HEES) closed the most recent trading day at $49.45, moving +0.26% from the previous trading session. |
H&E Equipment Services, Inc. (HEES) Hit a 52 Week High, Can the Run Continue?H&E Equipment (HEES) is at a 52-week high, but can investors hope for more gains in the future? We take a look at the company's fundamentals for clues. |
Here's Why Momentum in H&E Equipment (HEES) Should Keep goingIf you are looking for stocks that are well positioned to maintain their recent uptrend, H&E Equipment (HEES) could be a great choice. It is one of the several stocks that passed through our "Recent Price Strength" screen. |
Should Value Investors Buy H&E Equipment Services (HEES) Stock?Here at Zacks, our focus is on the proven Zacks Rank system, which emphasizes earnings estimates and estimate revisions to find great stocks. Nevertheless, we are always paying attention to the latest value, growth, and momentum trends to underscore strong picks. |
Top Infrastructure Stock Hits Buy Point As Industry Group ProspersInfrastructure stock H&E Equipment Services is in the buy zone after breaking out of a cup-with-handle base. The company sells, rents, repairs and maintains heavy construction and industrial equipment through more than 100 service centers. HEES stock has gained more than 5% this year and more than 40% since July 2022. |
HEES Price Returns
1-mo | 11.85% |
3-mo | 31.83% |
6-mo | 48.71% |
1-year | 29.31% |
3-year | 109.17% |
5-year | 55.21% |
YTD | 11.85% |
2022 | 5.61% |
2021 | 53.08% |
2020 | -6.19% |
2019 | 70.40% |
2018 | -47.98% |
HEES Dividends
Ex-Dividend Date | Type | Payout Amount | Change | ||||||
---|---|---|---|---|---|---|---|---|---|
Loading, please wait... |
Continue Researching HEES
Here are a few links from around the web to help you further your research on H&E Equipment Services Inc's stock as an investment opportunity:H&E Equipment Services Inc (HEES) Stock Price | Nasdaq
H&E Equipment Services Inc (HEES) Stock Quote, History and News - Yahoo Finance
H&E Equipment Services Inc (HEES) Stock Price and Basic Information | MarketWatch
Loading social stream, please wait...