Hallador Energy Company (HNRG): Price and Financial Metrics
HNRG Price/Volume Stats
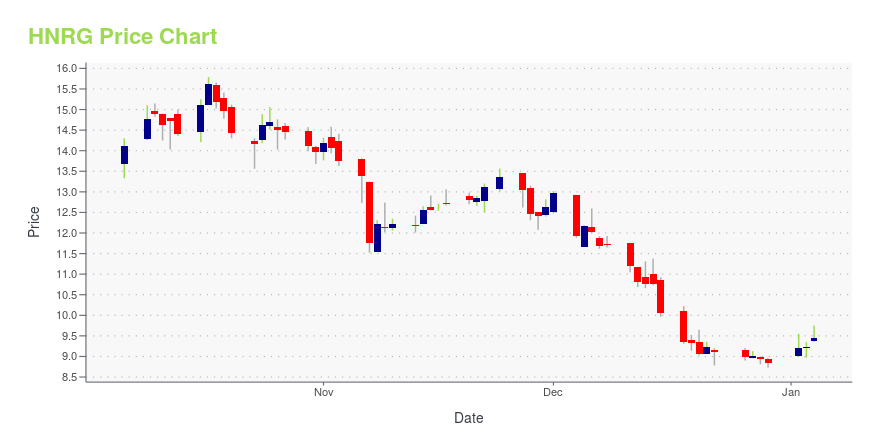
Current price | $7.97 | 52-week high | $11.57 |
Prev. close | $8.10 | 52-week low | $4.70 |
Day low | $7.81 | Volume | 260,300 |
Day high | $8.20 | Avg. volume | 189,296 |
50-day MA | $8.62 | Dividend yield | N/A |
200-day MA | $8.05 | Market Cap | 264.10M |
HNRG Stock Price Chart Interactive Chart >
HNRG POWR Grades
- HNRG scores best on the Growth dimension, with a Growth rank ahead of 97.11% of US stocks.
- HNRG's strongest trending metric is Quality; it's been moving up over the last 179 days.
- HNRG's current lowest rank is in the Stability metric (where it is better than 14.55% of US stocks).
HNRG Stock Summary
- Of note is the ratio of HALLADOR ENERGY CO's sales and general administrative expense to its total operating expenses; just 11.72% of US stocks have a lower such ratio.
- Over the past twelve months, HNRG has reported earnings growth of -2,154.49%, putting it ahead of merely 1.08% of US stocks in our set.
- As for revenue growth, note that HNRG's revenue has grown 89.1% over the past 12 months; that beats the revenue growth of 92.87% of US companies in our set.
- Stocks that are quantitatively similar to HNRG, based on their financial statements, market capitalization, and price volatility, are SNCY, EQT, AMR, DEN, and AR.
- Visit HNRG's SEC page to see the company's official filings. To visit the company's web site, go to www.halladorenergy.com.
HNRG Valuation Summary
- In comparison to the median Basic Materials stock, HNRG's price/earnings ratio is 52.71% lower, now standing at 6.1.
- Over the past 243 months, HNRG's price/sales ratio has gone down 0.2.
Below are key valuation metrics over time for HNRG.
Stock | Date | P/S | P/B | P/E | EV/EBIT |
---|---|---|---|---|---|
HNRG | 2023-05-17 | 0.6 | 1.3 | 6.1 | 5.7 |
HNRG | 2023-05-16 | 0.6 | 1.3 | 6.0 | 5.6 |
HNRG | 2023-05-15 | 0.6 | 1.3 | 6.2 | 5.8 |
HNRG | 2023-05-12 | 0.6 | 1.3 | 6.0 | 5.7 |
HNRG | 2023-05-11 | 0.6 | 1.3 | 6.0 | 5.6 |
HNRG | 2023-05-10 | 0.6 | 1.3 | 6.1 | 5.7 |
HNRG Growth Metrics
- Its 3 year net cashflow from operations growth rate is now at -18.99%.
- Its year over year revenue growth rate is now at 13.26%.
- Its year over year cash and equivalents growth rate is now at -0.75%.

The table below shows HNRG's growth in key financial areas (numbers in millions of US dollars).
Date | Revenue | Operating Cash Flow | Net Income to Common Stock |
---|---|---|---|
2022-09-30 | 275.431 | 24.878 | -19.652 |
2022-06-30 | 270.169 | 35.365 | -13.278 |
2022-03-31 | 259.878 | 47.978 | -12.856 |
2021-12-31 | 247.666 | 47.974 | -3.754 |
2021-09-30 | 247.703 | 55.498 | -0.747 |
2021-06-30 | 233.009 | 48.29 | -6.81 |
HNRG's Quality Factors
The “Quality” component of the POWR Ratings focuses on 31 different factors of a companies fundamentals and operational strength. Here are some key insights as we drill into the specifics of these quality attributes.- HNRG has a Quality Grade of C, ranking ahead of 69.97% of graded US stocks.
- HNRG's asset turnover comes in at 0.603 -- ranking 6th of 9 Coal stocks.
- HCC, ARLP, and NRP are the stocks whose asset turnover ratios are most correlated with HNRG.
The table below shows HNRG's key quality metrics over time.
Period | Asset Turnover | Gross Margin | ROIC |
---|---|---|---|
2021-06-30 | 0.603 | 0.237 | -0.001 |
2021-03-31 | 0.581 | 0.253 | 0.006 |
2020-12-31 | 0.609 | 0.242 | 0.009 |
2020-09-30 | 0.625 | 0.260 | -0.131 |
2020-06-30 | 0.628 | 0.218 | -0.143 |
2020-03-31 | 0.637 | 0.212 | -0.141 |
HNRG Price Target
For more insight on analysts targets of HNRG, see our HNRG price target page. And for a list of of all stocks sorted by upside potential based on analyst target price, see our Top Price Target page.
Average Price Target | $4.00 | Average Broker Recommendation | 1.5 (Moderate Buy) |
Hallador Energy Company (HNRG) Company Bio
Hallador Energy Company, through its subsidiaries, engages in the mining, production, and sale of steam coal for the electric power generation industry in the United States.
Latest HNRG News From Around the Web
Below are the latest news stories about HALLADOR ENERGY CO that investors may wish to consider to help them evaluate HNRG as an investment opportunity.
Hallador Energy Company Reports First Quarter 2023 Financial and Operating ResultsTERRE HAUTE, Ind., May 08, 2023 (GLOBE NEWSWIRE) -- Hallador Energy Company (NASDAQ – HNRG) today reported a net income of $22.1 million, $.67 basic earnings per share, and adjusted EBITDA of $34.0 million for the quarter ended March 31, 2023. Brent Bilsland, President and Chief Executive Officer, stated, "We have delivered strong back-to-back quarters of increasing EBITDA and ongoing debt reduction, which has significantly delevered our balance sheet to 1.2 times debt to EBITDA. We expect coal |
Hallador Energy (HNRG) Tops Q1 Earnings and Revenue EstimatesHallador Energy (HNRG) delivered earnings and revenue surprises of 281.25% and 23.99%, respectively, for the quarter ended March 2023. Do the numbers hold clues to what lies ahead for the stock? |
Hallador Energy Company Announces First Quarter 2023 Earnings Release and Investor CallTERRE HAUTE, Ind., May 04, 2023 (GLOBE NEWSWIRE) -- (Nasdaq: HNRG) – Hallador Energy Company today announced that the Company plans to release its 1st quarter 2023 financial results on Form 10-Q after the markets close on Monday, May 8, 2023. Earnings Conference Call and Webcast Management will host an investor conference call and webcast on Tuesday, May 9, 2023, at 2:00 p.m. ET to discuss its 1st quarter 2023 financial results. The call will be webcast live on our website at www.halladorenergy. |
Those who invested in Hallador Energy (NASDAQ:HNRG) three years ago are up 962%Hallador Energy Company ( NASDAQ:HNRG ) shareholders have seen the share price descend 12% over the month. But that... |
Is Hallador Energy Company (HNRG) a Good Investment?Investment management company Cove Street Capital recently released its “Small Cap Value Fund” first quarter 2023 investor letter. A copy of the same can be downloaded here. In the first quarter, the fund returned 2.83% compared to 2.74% for the Russell 2000 Index and -0.66% for the Russell 2000 Value Index. In addition, you can check the top […] |
HNRG Price Returns
1-mo | -0.87% |
3-mo | 4.18% |
6-mo | -21.86% |
1-year | N/A |
3-year | 1,032.75% |
5-year | 14.11% |
YTD | -20.22% |
2022 | 306.10% |
2021 | 67.35% |
2020 | -49.34% |
2019 | -39.39% |
2018 | -14.71% |
Continue Researching HNRG
Want to see what other sources are saying about Hallador Energy Co's financials and stock price? Try the links below:Hallador Energy Co (HNRG) Stock Price | Nasdaq
Hallador Energy Co (HNRG) Stock Quote, History and News - Yahoo Finance
Hallador Energy Co (HNRG) Stock Price and Basic Information | MarketWatch
Loading social stream, please wait...