HealthEquity, Inc. (HQY): Price and Financial Metrics
HQY Price/Volume Stats
Current price | $73.05 | 52-week high | $79.20 |
Prev. close | $74.33 | 52-week low | $48.86 |
Day low | $72.83 | Volume | 520,000 |
Day high | $74.67 | Avg. volume | 658,380 |
50-day MA | $68.45 | Dividend yield | N/A |
200-day MA | $62.08 | Market Cap | 6.25B |
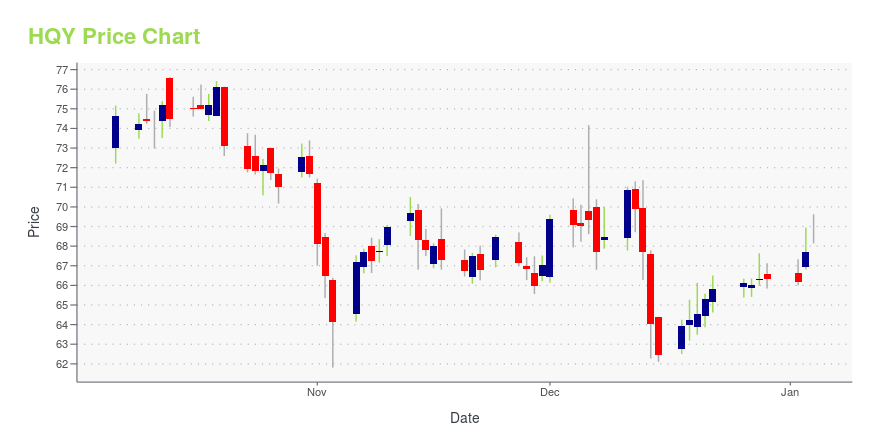
HQY Stock Price Chart Interactive Chart >
HQY POWR Grades
- HQY scores best on the Growth dimension, with a Growth rank ahead of 97.15% of US stocks.
- The strongest trend for HQY is in Growth, which has been heading up over the past 177 days.
- HQY's current lowest rank is in the Value metric (where it is better than 12.9% of US stocks).
HQY Stock Summary
- With a price/earnings ratio of 485.06, HEALTHEQUITY INC P/E ratio is greater than that of about 98.84% of stocks in our set with positive earnings.
- The price/operating cash flow metric for HEALTHEQUITY INC is higher than 86.69% of stocks in our set with a positive cash flow.
- Over the past twelve months, HQY has reported earnings growth of -280.96%, putting it ahead of just 5.31% of US stocks in our set.
- Stocks with similar financial metrics, market capitalization, and price volatility to HEALTHEQUITY INC are IDR, UEC, NKTR, CERS, and ASXC.
- HQY's SEC filings can be seen here. And to visit HEALTHEQUITY INC's official web site, go to www.healthequity.com.
HQY Valuation Summary
- HQY's price/sales ratio is 6.6; this is 247.37% higher than that of the median Healthcare stock.
- Over the past 111 months, HQY's EV/EBIT ratio has gone up 26934.9.
Below are key valuation metrics over time for HQY.
Stock | Date | P/S | P/B | P/E | EV/EBIT |
---|---|---|---|---|---|
HQY | 2023-09-22 | 6.6 | 3.2 | 485.1 | 94.3 |
HQY | 2023-09-21 | 6.6 | 3.2 | 482.0 | 93.8 |
HQY | 2023-09-20 | 6.5 | 3.1 | 473.8 | 92.3 |
HQY | 2023-09-19 | 6.5 | 3.1 | 473.7 | 92.3 |
HQY | 2023-09-18 | 6.2 | 3.0 | 452.7 | 88.6 |
HQY | 2023-09-15 | 6.3 | 3.0 | 460.9 | 90.1 |
HQY Growth Metrics
- Its 5 year net income to common stockholders growth rate is now at -101.03%.
- The 2 year revenue growth rate now stands at 22.53%.
- The 2 year price growth rate now stands at 9.54%.

The table below shows HQY's growth in key financial areas (numbers in millions of US dollars).
Date | Revenue | Operating Cash Flow | Net Income to Common Stock |
---|---|---|---|
2022-09-30 | 831.204 | 145.716 | -58.752 |
2022-06-30 | 795.072 | 120.055 | -62.149 |
2022-03-31 | 778.033 | 117.154 | -55.313 |
2021-12-31 | 756.556 | 140.995 | -44.289 |
2021-09-30 | 741.428 | 151.34 | -6.104 |
2021-06-30 | 740.825 | 181.123 | 0.723 |
HQY's Quality Factors
The “Quality” component of the POWR Ratings focuses on 31 different factors of a companies fundamentals and operational strength. Here are some key insights as we drill into the specifics of these quality attributes.- HQY has a Quality Grade of C, ranking ahead of 51.06% of graded US stocks.
- HQY's asset turnover comes in at 0.254 -- ranking 461st of 561 Business Services stocks.
- CTEK, WK, and ACIW are the stocks whose asset turnover ratios are most correlated with HQY.
The table below shows HQY's key quality metrics over time.
Period | Asset Turnover | Gross Margin | ROIC |
---|---|---|---|
2021-07-31 | 0.254 | 0.568 | 0.014 |
2021-04-30 | 0.260 | 0.564 | 0.021 |
2021-01-31 | 0.277 | 0.566 | 0.031 |
2020-10-31 | 0.286 | 0.573 | 0.036 |
2020-07-31 | 0.280 | 0.579 | 0.011 |
2020-04-30 | 0.289 | 0.593 | 0.028 |
HQY Price Target
For more insight on analysts targets of HQY, see our HQY price target page. And for a list of of all stocks sorted by upside potential based on analyst target price, see our Top Price Target page.
Average Price Target | $87.20 | Average Broker Recommendation | 1.42 (Moderate Buy) |
HealthEquity, Inc. (HQY) Company Bio
HealthEquity Inc. provides various solutions for managing health care accounts, health reimbursement arrangements, and flexible spending accounts for health plans, insurance companies, and third-party administrators in the United States. The company was founded in 2002 and is based in Draper, Utah.
Latest HQY News From Around the Web
Below are the latest news stories about HEALTHEQUITY INC that investors may wish to consider to help them evaluate HQY as an investment opportunity.
3 Reasons to Hold HealthEquity (HQY) Stock in Your PortfolioHealthEquity's (HQY) strength in HSA raises optimism about the stock. |
Abbott (ABT) Closes Acquisition Deal of Bigfoot BiomedicalAbbott's (ABT) footprint in the diabetes care market is increased by the Bigfoot Biomedical acquisition. |
10 Stocks Receiving a Massive Vote of Approval From Wall Street AnalystsIn this article, we will take a look at the 10 stocks receiving a massive vote of approval from Wall Street analysts. If you want to see some more stocks on the list, go directly to 5 Stocks Receiving a Massive Vote of Approval From Wall Street Analysts. Asian stock markets experienced a decline on September […] |
Hologic (HOLX) to Boost Breast Imaging Modality With New PactHologic's (HOLX) collaboration with Bayer will enable physicians everywhere to include CEM in their breast cancer diagnosis workflows. |
3 Reasons to Hold Veeva Systems (VEEV) Stock in Your PortfolioVeeva Systems' (VEEV) strong product portfolio raises optimism about the stock. |
HQY Price Returns
1-mo | 8.14% |
3-mo | 15.70% |
6-mo | 27.42% |
1-year | 8.75% |
3-year | 42.20% |
5-year | -20.87% |
YTD | 18.51% |
2022 | 39.33% |
2021 | -36.54% |
2020 | -5.89% |
2019 | 24.17% |
2018 | 27.84% |
Continue Researching HQY
Want to see what other sources are saying about Healthequity Inc's financials and stock price? Try the links below:Healthequity Inc (HQY) Stock Price | Nasdaq
Healthequity Inc (HQY) Stock Quote, History and News - Yahoo Finance
Healthequity Inc (HQY) Stock Price and Basic Information | MarketWatch
Loading social stream, please wait...