Host Hotels & Resorts Inc. (HST): Price and Financial Metrics
HST Price/Volume Stats
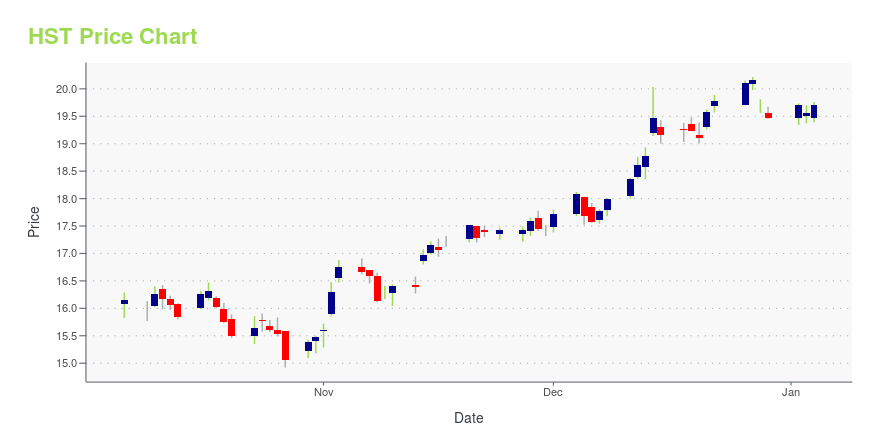
Current price | $16.04 | 52-week high | $19.42 |
Prev. close | $15.84 | 52-week low | $14.51 |
Day low | $15.86 | Volume | 6,153,657 |
Day high | $16.18 | Avg. volume | 7,062,248 |
50-day MA | $16.49 | Dividend yield | 3.8% |
200-day MA | $16.81 | Market Cap | 11.41B |
HST Stock Price Chart Interactive Chart >
HST POWR Grades
- Value is the dimension where HST ranks best; there it ranks ahead of 68.61% of US stocks.
- HST's strongest trending metric is Growth; it's been moving down over the last 177 days.
- HST's current lowest rank is in the Growth metric (where it is better than 6.11% of US stocks).
HST Stock Summary
- HOST HOTELS & RESORTS INC's stock had its IPO on January 1, 1986, making it an older stock than 93.16% of US equities in our set.
- Of note is the ratio of HOST HOTELS & RESORTS INC's sales and general administrative expense to its total operating expenses; just 5.36% of US stocks have a lower such ratio.
- The volatility of HOST HOTELS & RESORTS INC's share price is greater than that of merely 8.66% US stocks with at least 200 days of trading history.
- If you're looking for stocks that are quantitatively similar to HOST HOTELS & RESORTS INC, a group of peers worth examining would be PEAK, AMH, DRH, GMRE, and PECO.
- HST's SEC filings can be seen here. And to visit HOST HOTELS & RESORTS INC's official web site, go to www.hosthotels.com.
HST Valuation Summary
- HST's price/earnings ratio is 15.2; this is 43.49% lower than that of the median Real Estate stock.
- HST's price/sales ratio has moved up 1.4 over the prior 243 months.
Below are key valuation metrics over time for HST.
Stock | Date | P/S | P/B | P/E | EV/EBIT |
---|---|---|---|---|---|
HST | 2023-09-20 | 2.2 | 1.7 | 15.2 | 16.3 |
HST | 2023-09-19 | 2.2 | 1.7 | 15.3 | 16.4 |
HST | 2023-09-18 | 2.2 | 1.7 | 15.4 | 16.5 |
HST | 2023-09-15 | 2.3 | 1.7 | 15.6 | 16.6 |
HST | 2023-09-14 | 2.2 | 1.7 | 15.3 | 16.4 |
HST | 2023-09-13 | 2.2 | 1.6 | 15.0 | 16.2 |
HST Growth Metrics
- Its 4 year net income to common stockholders growth rate is now at -0.95%.
- Its 3 year revenue growth rate is now at -35.97%.
- Its 5 year net income to common stockholders growth rate is now at -0.95%.

The table below shows HST's growth in key financial areas (numbers in millions of US dollars).
Date | Revenue | Operating Cash Flow | Net Income to Common Stock |
---|---|---|---|
2022-09-30 | 4,642 | 1,270 | 806 |
2022-06-30 | 4,297 | 1,040 | 573 |
2022-03-31 | 3,565 | 602 | 257 |
2021-12-31 | 2,890 | 292 | -11 |
2021-09-30 | 2,159 | -65 | -395 |
2021-06-30 | 1,513 | -332 | -589 |
HST's Quality Factors
The “Quality” component of the POWR Ratings focuses on 31 different factors of a companies fundamentals and operational strength. Here are some key insights as we drill into the specifics of these quality attributes.- HST has a Quality Grade of D, ranking ahead of 8.48% of graded US stocks.
- HST's asset turnover comes in at 0.118 -- ranking 171st of 444 Trading stocks.
- DRH, CBLAQ, and RLJ are the stocks whose asset turnover ratios are most correlated with HST.
The table below shows HST's key quality metrics over time.
Period | Asset Turnover | Gross Margin | ROIC |
---|---|---|---|
2021-06-30 | 0.118 | -0.045 | -0.035 |
2021-03-31 | 0.076 | -0.366 | -0.055 |
2020-12-31 | 0.126 | -0.123 | -0.046 |
2020-09-30 | 0.211 | 0.093 | -0.031 |
2020-06-30 | 0.294 | 0.189 | 0.015 |
2020-03-31 | 0.399 | 0.261 | 0.059 |
HST Price Target
For more insight on analysts targets of HST, see our HST price target page. And for a list of of all stocks sorted by upside potential based on analyst target price, see our Top Price Target page.
Average Price Target | $18.39 | Average Broker Recommendation | 1.75 (Moderate Buy) |
Host Hotels & Resorts Inc. (HST) Company Bio
Host Hotels & Resorts, Inc. is an American real estate investment trust that invests in hotels. As of February 19, 2021, the company owned 80 upscale hotels containing approximately 46,500 rooms in the United States, Brazil, and Canada. (Source:Wikipedia)
Latest HST News From Around the Web
Below are the latest news stories about HOST HOTELS & RESORTS INC that investors may wish to consider to help them evaluate HST as an investment opportunity.
Here's Why You Should Retain Host Hotels (HST) Stock for NowStrong Sunbelt exposure and capital-recycling efforts are likely to support Host Hotels (HST). However, constrained business and group travel demand and high interest rates are concerning. |
3 REITs That Just Increased DividendsInvestors are always eager to hear that a stock in their portfolio has announced a dividend increase. For income investors, it means a monthly or quarterly raise. For investors who are also concerned with growth, such dividend hikes can portend an increase in future earnings. A dividend increase often indicates that the company's board of directors has faith that future earnings can cover the dividend hike comfortably. In addition, a dividend increase often makes the stock more attractive to inv |
Host Hotels & Resorts Announces Third Quarter 2023 Earnings Call to be Held on November 2, 2023BETHESDA, Md., Sept. 18, 2023 (GLOBE NEWSWIRE) -- Host Hotels & Resorts, Inc. (NASDAQ: HST) (the “Company”), the nation’s largest lodging real estate investment trust, will report third quarter 2023 financial results on Wednesday, November 1, 2023, after the market close. The Company will hold a conference call to discuss its third quarter 2023 results and business outlook on Thursday, November 2, 2023, at 11:00 a.m. ET. Conference call access information is as follows: Conference Call: USA Toll |
Host Hotels & Resorts Inc (HST): A Deep Dive into Its Performance PotentialUnraveling the Factors That Could Limit the Company's Future Growth |
Unveiling Host Hotels & Resorts (HST)'s Value: Is It Really Priced Right? A Comprehensive GuideDelving into the intrinsic value of Host Hotels & Resorts (HST) to ascertain its true market worth |
HST Price Returns
1-mo | 1.33% |
3-mo | -3.89% |
6-mo | -1.84% |
1-year | 6.40% |
3-year | 58.43% |
5-year | -13.46% |
YTD | 1.63% |
2022 | -4.62% |
2021 | 18.87% |
2020 | -19.71% |
2019 | 16.65% |
2018 | -12.15% |
HST Dividends
Ex-Dividend Date | Type | Payout Amount | Change | ||||||
---|---|---|---|---|---|---|---|---|---|
Loading, please wait... |
Continue Researching HST
Here are a few links from around the web to help you further your research on Host Hotels & Resorts Inc's stock as an investment opportunity:Host Hotels & Resorts Inc (HST) Stock Price | Nasdaq
Host Hotels & Resorts Inc (HST) Stock Quote, History and News - Yahoo Finance
Host Hotels & Resorts Inc (HST) Stock Price and Basic Information | MarketWatch
Loading social stream, please wait...