
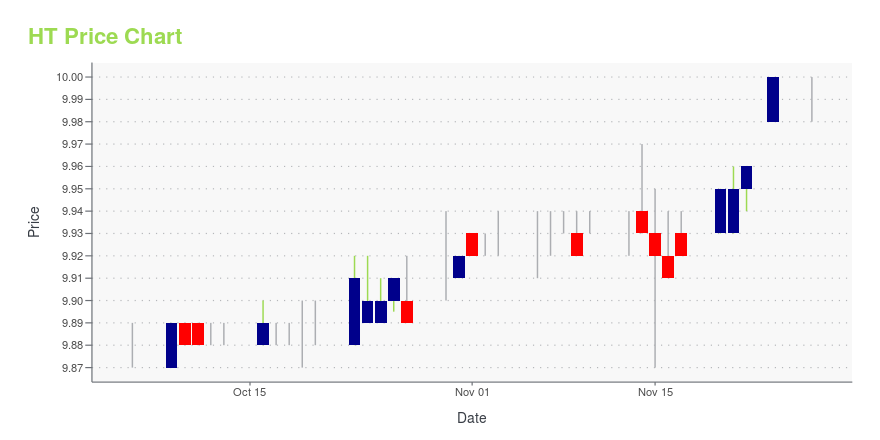
Hersha Hospitality Trust Class A Common Shares of Beneficial Interest (HT): Price and Financial Metrics
HT Price/Volume Stats
| Current price | $9.99 | 52-week high | $10.31 |
| Prev. close | $10.00 | 52-week low | $5.64 |
| Day low | $9.98 | Volume | 1,489,200 |
| Day high | $10.00 | Avg. volume | 661,466 |
| 50-day MA | $9.90 | Dividend yield | 2% |
| 200-day MA | $7.63 | Market Cap | 402.56M |
HT Stock Price Chart Interactive Chart >
Hersha Hospitality Trust Class A Common Shares of Beneficial Interest (HT) Company Bio
Hersha Hospitality Trust owns and operates mid scale limited service hotels in Pennsylvania, New York, New Jersey, Maryland, Georgia, Connecticut, and Massachusetts. The company was founded in 1998 and is based in New Cumberland, Pennsylvania.
Latest HT News From Around the Web
Below are the latest news stories about HERSHA HOSPITALITY TRUST that investors may wish to consider to help them evaluate HT as an investment opportunity.
Stocks to Sell: 7 Overbought Companies You Ought to Dump Right NowOverbought stocks are an early indication of a potential correction on a stock; act now if you hold these stocks. |
Hersha Hospitality Trust Announces Date of Special Meeting to Approve Acquisition by KSL Capital PartnersPHILADELPHIA, Oct. 03, 2023 (GLOBE NEWSWIRE) -- Hersha Hospitality Trust (NYSE: HT) (“Hersha” or the “Company”), owner of luxury and lifestyle hotels in coastal gateway and resort markets, announced that it has set November 8, 2023 as the date for the special meeting of shareholders (the “Special Meeting”) to approve the previously announced acquisition by affiliates of KSL Capital Partners, LLC ("KSL"), a leading investor in travel and leisure businesses. The Special Meeting will be held virtua |
Don’t Miss the Boom: 7 Cryptos Set to Explode HigherThese are the cryptos to buy for multibagger returns in the next 24 months |
Hersha Hospitality Trust Announces Quarterly DividendPHILADELPHIA, Sept. 13, 2023 (GLOBE NEWSWIRE) -- Hersha Hospitality Trust (NYSE: HT) (“Hersha” or the “Company”), owner of luxury and lifestyle hotels in coastal gateway and resort markets, today announced its Board of Trustees has approved a cash dividend of $0.05 per common share and per limited partnership unit for the third quarter ending September 30, 2023. These common share dividends and limited partnership unit distributions are payable October 16, 2023 to holders of record as of Septemb |
The Best-Performing REITs In AugustThe waning days of summer proved to be difficult for U.S. markets and real estate investment trusts (REITs). Many popular REITs produced double-digit losses for the month, but some lesser-known REITs managed to produce healthy gains. Healthcare, office and hotel REITs were among the best-performing subsectors, but a few of the top performers achieved that ranking simply from being acquisition targets. Take a look at the best three well-performing REITs for August (closing prices as of Aug. 30) a |
HT Price Returns
| 1-mo | N/A |
| 3-mo | N/A |
| 6-mo | N/A |
| 1-year | 65.42% |
| 3-year | 11.76% |
| 5-year | -25.86% |
| YTD | N/A |
| 2023 | 0.00% |
| 2022 | -0.15% |
| 2021 | 16.22% |
| 2020 | -40.61% |
| 2019 | -11.12% |
HT Dividends
| Ex-Dividend Date | Type | Payout Amount | Change | ||||||
|---|---|---|---|---|---|---|---|---|---|
| Loading, please wait... | |||||||||
Continue Researching HT
Here are a few links from around the web to help you further your research on Hersha Hospitality Trust's stock as an investment opportunity:Hersha Hospitality Trust (HT) Stock Price | Nasdaq
Hersha Hospitality Trust (HT) Stock Quote, History and News - Yahoo Finance
Hersha Hospitality Trust (HT) Stock Price and Basic Information | MarketWatch
Loading social stream, please wait...